Get ready: A new V8 is coming, Node.js performance is changing.
How the performance characteristics of v8's Turbofan will affect the way we optimize
Reviewers: Franziska Hinkelmann and Benedikt Meurer from the V8 team.
**Update: Node.js 8.3.0 has shipped V8 6.0 with Turbofan .
Since its inception Node.js has depended on the V8 JavaScript engine to provide code execution in the language we all know and love. The V8 JavaScript engine is a JavaScript VM that was written by Google for the Chrome browser. From the beginning, a primary goal of V8 was to make JavaScript fast, or at least - faster than the competition. For a highly dynamic, loosely typed language this is no easy feat. This piece is about the evolution of V8 and JS engines' performance.
A central piece of the V8 engine that allows it to execute JavaScript at high speed is the JIT (Just In Time) compiler. This is a dynamic compiler that can optimize code during runtime. When V8 was first built the JIT Compiler was dubbed FullCodegen. Then, the V8 team implemented Crankshaft, which included many performance optimizations that FullCodegen did not implement. Edit: FullCodegen was the first optimizing compiler of V8, thanks to Yang Guo for reporting. As an outside observer and user of JavaScript since the 90's, it has seemed that fast and slow paths in JavaScript (whatever the engine may be) were often counter-intuitive, the reasons for apparently slow JavaScript code were often difficult to fathom.
In recent years Matteo Collina and I have focused on finding out how to write performant Node.js code. Of course, this means knowing which approaches are fast and which approaches are slow when our code is executed by the V8 JavaScript engine.
Now it's time for us to challenge all our assumptions about performance because the V8 team has written a new JIT Compiler: Turbofan.
Starting with the more commonly known "V8 Killers" (pieces of code which cause optimization bail-out - a term that no longer makes sense in a Turbofan context) and moving towards the more obscure discoveries Matteo and I have made around Crankshaft performance, we're going to walk through a series of microbenchmark results and observations over progressing versions of V8.
Of course, before optimizing for V8 logic paths, we should first focus on API design, algorithms and data structures. These microbenchmarks are meant as indicators of how JavaScript execution in Node is changing. We can use these indicators to influence our general code style and the ways we improve performance after we've applied the usual optimizations.
We'll be looking at the performance of these microbenchmarks on V8 versions 5.1, 5.8, 5.9, 6.0 and 6.1.
To put each of these versions into context: V8 5.1 is the engine used by Node 6 and uses the Crankshaft JIT Compiler, V8 5.8 is used in Node 8.0 to 8.2 and uses a mixture of Crankshaft and Turbofan.
Currently, 6.0 engine is due to be in Node 8.3 (or possibly Node 8.4) and V8 version 6.1 is the latest version of V8 (at the time of writing) which is integrated with Node on the experimental node-v8 repo at https://github.com/nodejs/node-v8 . In other words, V8 version 6.1 will eventually be in some future version of Node, likely Node.js 9.
Let's take a look at our microbenchmarks and on the other side, we'll talk about what this means for the future. All the microbenchmarks are executed using benchmark.js , and the values plotted are operation per second, so higher is better in every diagram.
The try/catch problem
One of the more well-known deoptimization patterns is use of try/catch blocks.
In this microbenchmark we compare four cases:
- a function with a
try/catchin it (sum with try catch) - a function without any
try/catch(sum without try catch) - calling a function within a
tryblock (sum wrapped) - simply calling a function, no
try/catchinvolved (sum function)
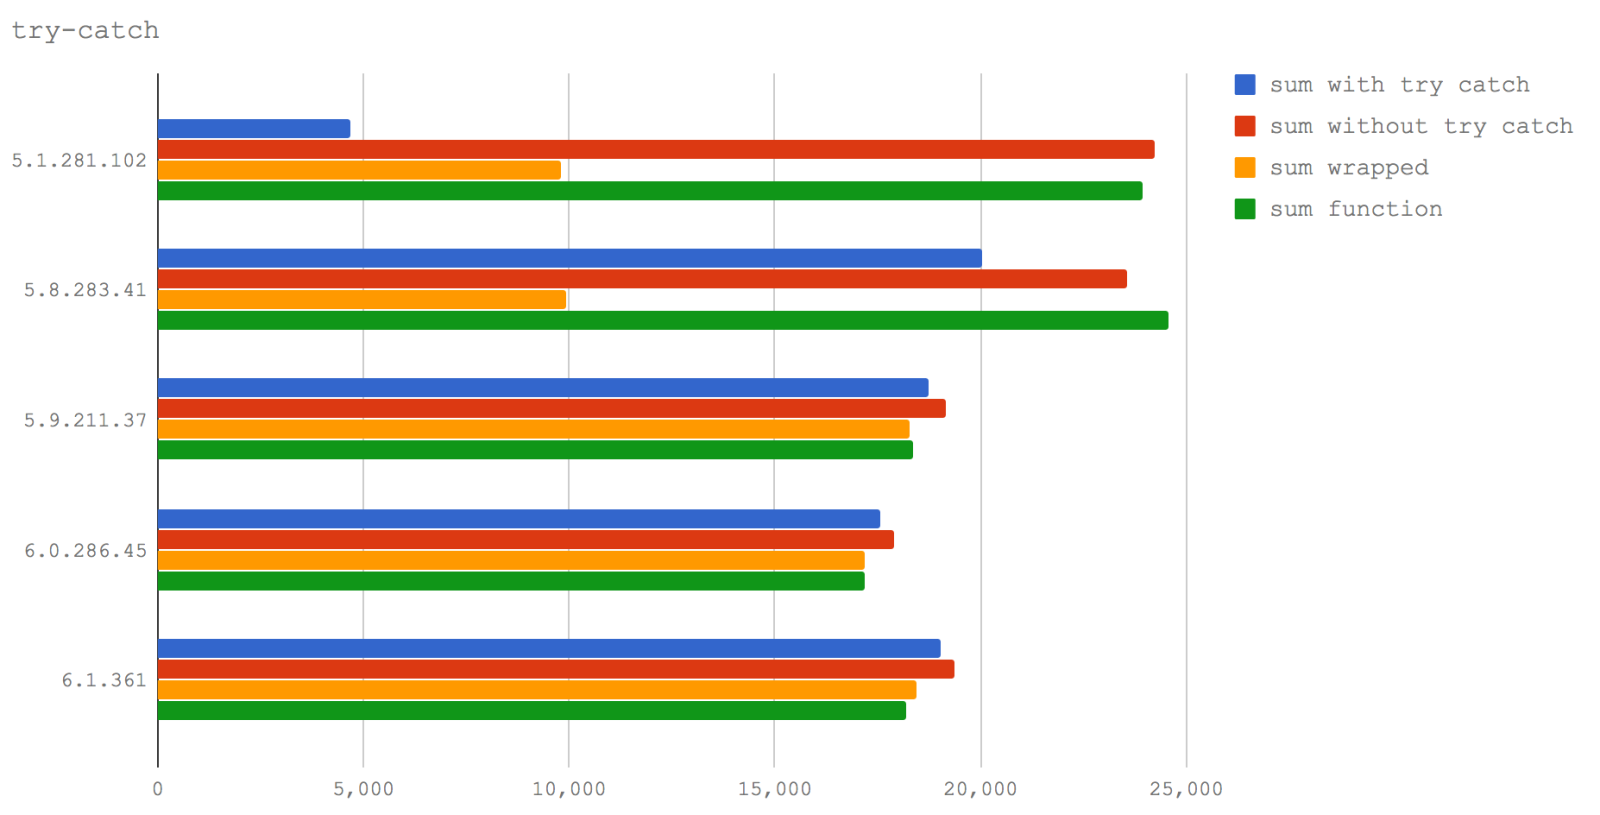
We can see that the existing wisdom around try/catch causing performance problems is true in Node 6 (V8 5.1) but has significantly less performance impact in Node 8.0-8.2 (V8 5.8).
Also of note, calling a function from within a try block is much slower than calling it from outside a try block - this holds true in both Node 6 (V8 5.1) and Node 8.0-8.2 (V8 5.8).
However, for Node 8.3+ the performance hit of calling a function inside a try block is negligible.
Nevertheless, don't rest too easy. While working on some performance workshop material, Matteo and I found a performance bug , where a rather specific combination of circumstances can lead to an infinite deoptimization/re-optimisation cycle in Turbofan (this would count as a "killer" - a pattern that destroys performance).
Removing properties from objects
For years now, delete has been off-limits to anyone wishing to write high-performance JavaScript (well at least where we're trying to write optimal code for a hot path).
The problem with delete boils down to the way V8 handles the dynamic nature of JavaScript objects and the (also potentially dynamic) prototype chains that make property lookups even more complex at an implementation level.
The V8 engine's technique for making property objects high speed is to create a class in the C++ layer based on the "shape" of the object. The shape is essentially what keys and values a property have (including the prototype chain keys and values). These are known as "hidden classes". However, this is an optimization that occurs on objects at runtime, if there's uncertainty about the shape of the object V8 has another mode for property retrieval: hash table lookup. The hash table lookup is significantly slower. Historically, when we delete a key from the object subsequent property access will be a hash table lookup. This is why we avoid delete and instead set properties to undefined which leads to the same result as far as values are concerned but may be problematic when checking for property existence; however it's often good enough for pre-serialization redaction because JSON.stringify does not include undefined values in its output ( undefined isn't a valid value in the JSON specification).
Now, let's see if the newer Turbofan implementation addresses the delete problem.
In this microbenchmark we compare three cases:
- serializing an object after an object's property has been set to
undefined - serializing an object after
deletehas been used to remove an object's property which was not the last property added. - serializing an object after
deletehas been used to remove the object's most recently added property.
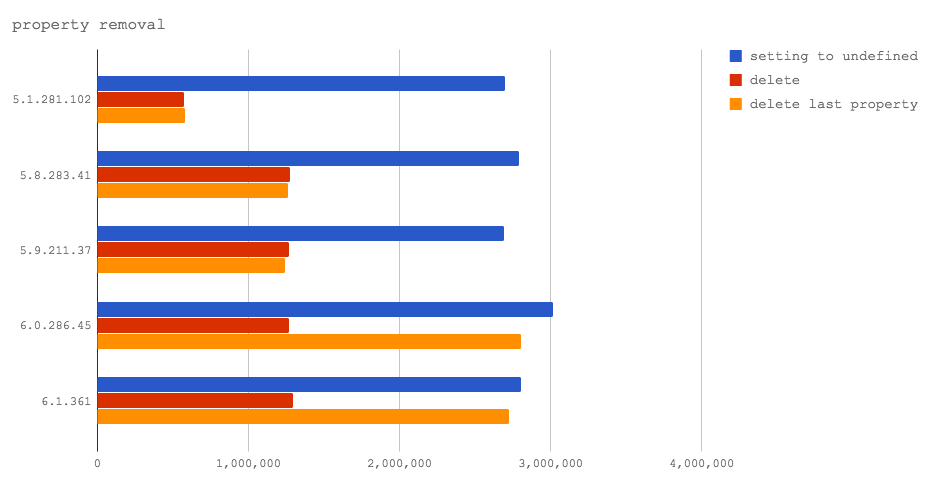
In V8 6.0 and 6.1 (not yet used in any Node releases), deleting the last property added to an object hits a fast path in V8, and thus it is faster, even, than setting to undefined . This is excellent news, as it shows that the V8 team is working towards improving the performance of delete . However, the delete operator will still result in a significant performance hit on property access if a property other than the most recently added property is deleted from the object. So overall we have to continue to recommend against using delete .
Edit: in a previous version of the post we concluded that delete could and should be used in future Node.js releases. However Jakob Kummerow let us know that our benchmarks only triggered the last property accessed case. Thanks Jakob Kummerow!
Leaking and arrayifying arguments
A common problem with the implicit arguments object available to normal JavaScript functions (as opposed to fat arrow functions which do not have arguments objects) is that its array-like but not an array.
In order to use array methods or most array behaviour, the indexing properties of the arguments object have been copied to an array. In the past JavaScripters have had a propensity towards equating less code with faster code. Whilst this rule of thumb yields a payload-size benefit for browser-side code, the same rule can cause pain on the server side where code size is far less important than execution speed. So a seductively terse way to convert the arguments object to an array became quite popular: Array.prototype.slice.call(arguments) . This calls the Array slice method passing the arguments object as the this context of that method, the slice method sees an object that quacks like an array and acts accordingly. That is, it takes a slice of the entire arguments array-like object as an array.
However, when a function's implicit arguments object is exposed from the context of the functions (for instance, when it's returned from the function or passed into another function as in the case of Array.prototype.slice.call(arguments) ) this typically causes performance degradation. Now it's time to challenge that assumption.
This next microbenchmark measures two interrelated topics across our four V8 versions: the cost of leaking arguments and the cost of copying arguments into an array (which is subsequently exposed from the function scope in place of the arguments object).
Here are our cases in detail:
- Exposing the
argumentsobject to another function - no array conversion (leaky arguments) - Making a copy of the
argumentsobject using theArray.prototype.slicetricks (Array prototype.slice arguments) - Using a for loop and copying each property across (for-loop copy arguments)
- Using the EcmaScript 2015 spread operator to assign an array of inputs to a reference (spread operator)
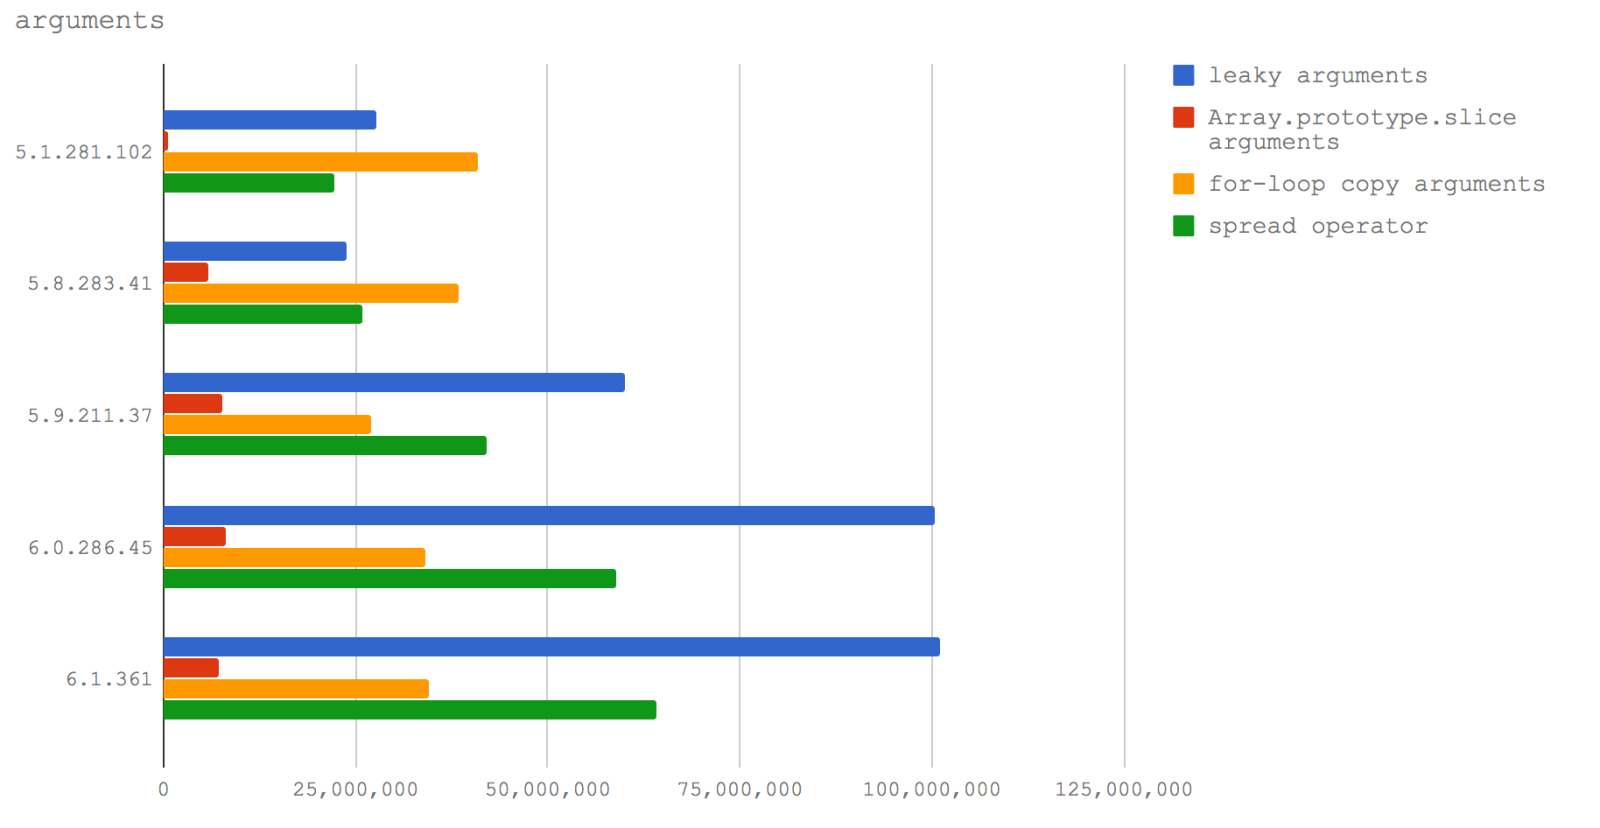
Let's take a look at the same data in line graph form to emphasise the change in performance characteristics:
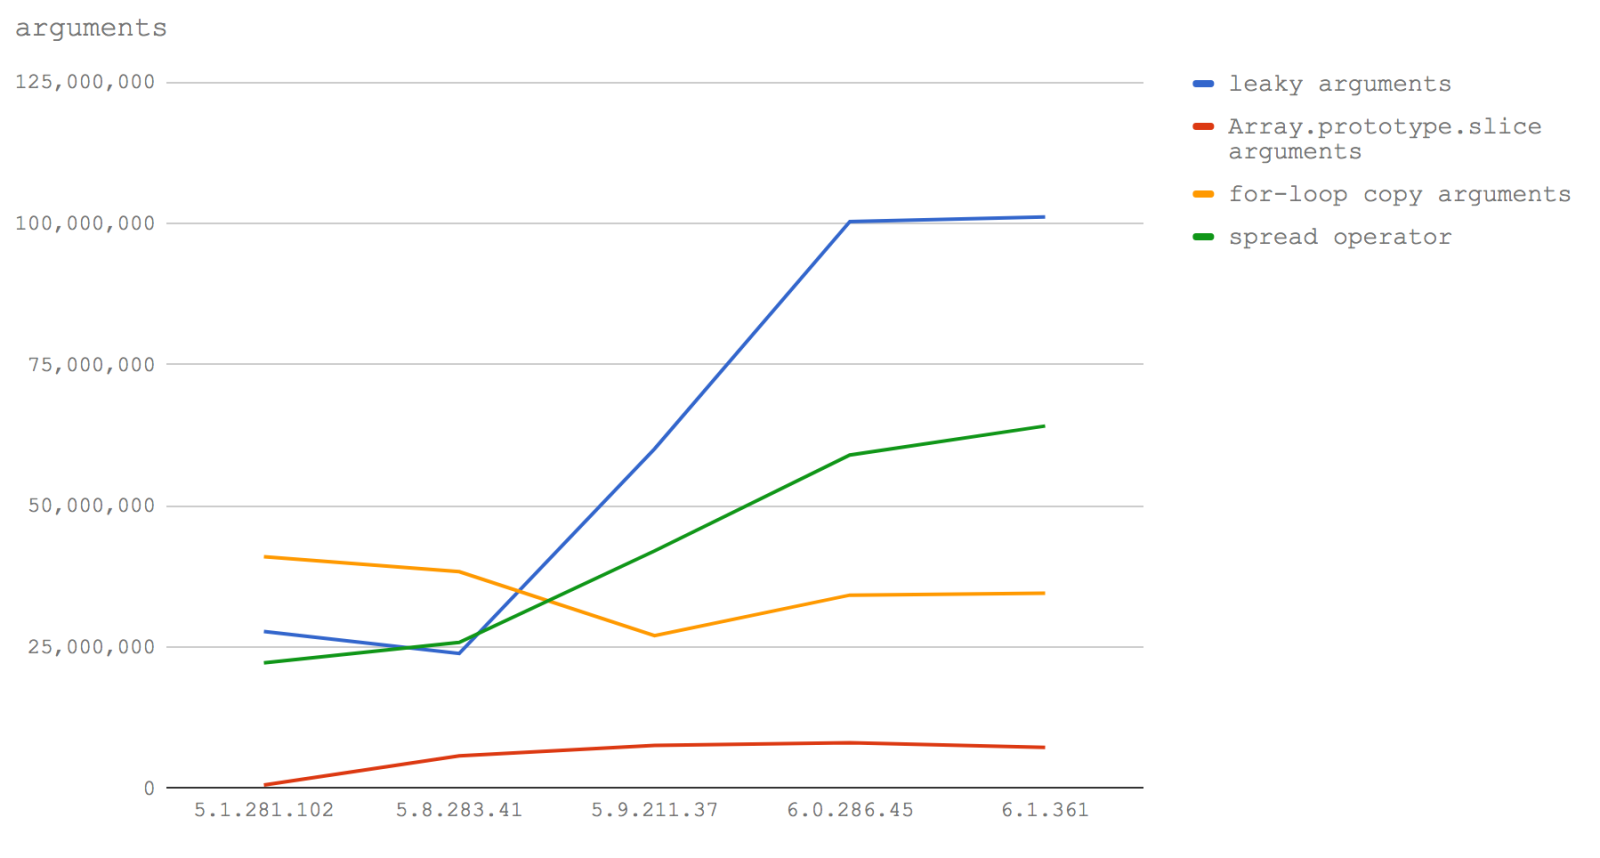
Here's the takeaway: if we want to write performant code around processing function inputs as an array (which in my experience seems fairly common), then in Node 8.3 and up we should use the spread operator. In Node 8.2 and down we should use a for loop to copy the keys from arguments into a new (pre-allocated)
array (see the benchmark code for details).
Further in Node 8.3+ we won't be punished for exposing the arguments object to other functions, so there may be further performance benefits in cases where we don't need a full array and can make do with an array-like structure.
Partial application (currying) and binding
Partial application (or currying) refers to the way we can capture state in nested closure scopes.
For instance:
function add (a, b) {
  return a + b
}
const add10 = function (n) {
  return add(10, n)
}
console.log(add10(20))
Here the a parameter of add is partially applied as the value 10 in the add10 function.
A terser form of partial application was made available with the bind method since EcmaScript 5:
function add (a, b) {
  return a + b
}
const add10 = add.bind(null, 10)
console.log(add10(20))
However, we would typically not use bind because is demonstrably slower than using a closure.
This benchmark measures the difference between bind and closure over our target V8 versions, with direct function calls as the control.
Here are our four cases:
- a function that calls another function with the first argument partially applied (curry)
- a fat arrow function that calls another function with the first argument partially applied (fat arrow curry)
- a function that is created via
bindthat partially applies the first argument of another function (bind) - a direct call to a function without any partial application (direct call)
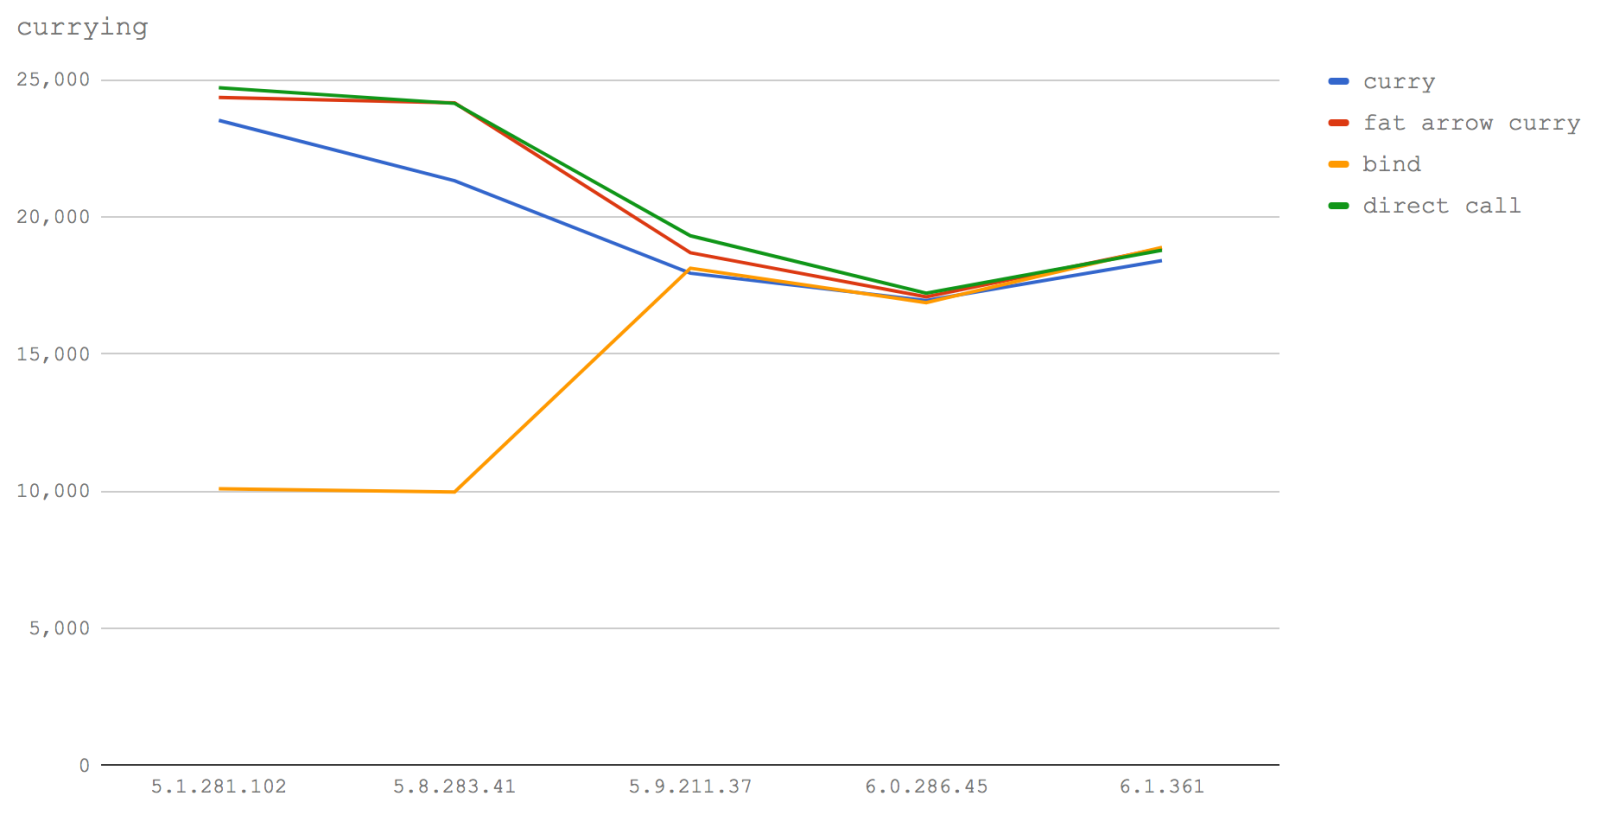
The line graph visualization of this benchmark's results clearly illustrates how the approaches converge in later versions of V8. Interestingly, partial application using fat arrow functions is significantly faster than using normal functions (at least in our microbenchmark case). In fact it almost traces the performance profile of making a direct call. In V8 5.1 (Node 6) and 5.8 (Node 8.0-8.2) bind is very slow by comparison, and it seems clear that using fat arrows for partial application is the fastest option. However bind speeds up by an order of magnitude from V8 version 5.9 (Node 8.3+) becoming the fastest approach (by an almost negligible amount) in version 6.1 (future Node).
The fastest approach to currying over all versions is using fat arrow functions. Code using fat arrow functions in later versions will be as close to using bind as makes no odds, and currently it's faster than using normal functions. However, as a caveat, we probably need to investigate more types of partial application with differently sized data structures to get a fuller picture.
Function character count
The size of a function, including its signature, the white space and even comments can affect whether the function can be inlined by V8 or not. Yes: adding a comment to your function may cause a performance hit somewhere in the range of a 10% speed reduction. Will this change with Turbofan? Let's find out.
In this benchmark we look at three scenarios:
- a call to a small function (sum small function)
- the operations of a small function performed inline, padded out with comments (long altogether)
- a call to a big function that has been padded with comments (sum long function)
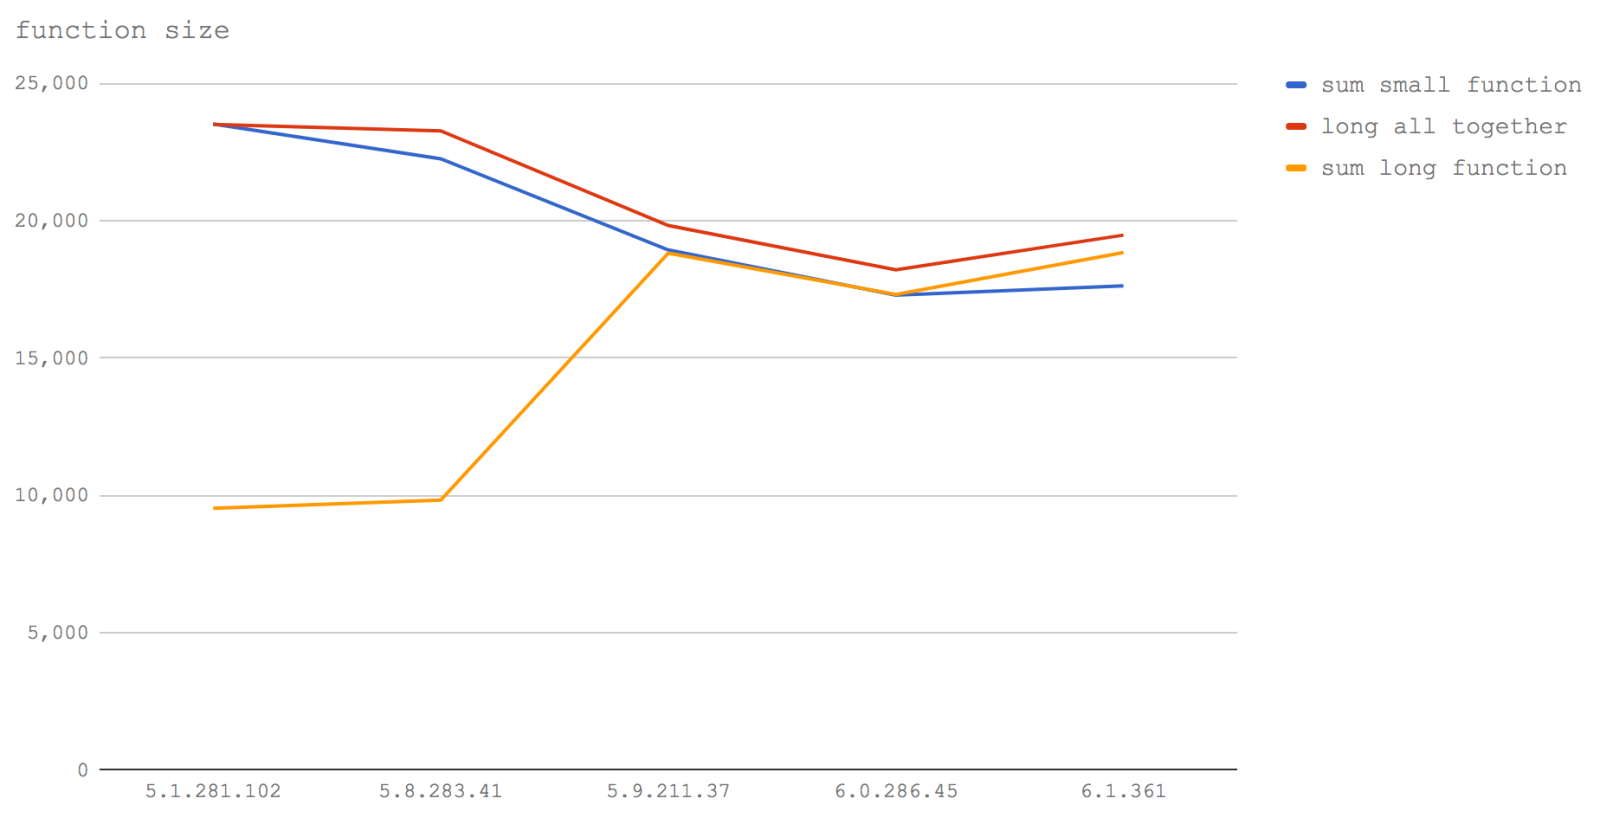
In V8 5.1 (Node 6) sum small function and long all together are equal. This perfectly illustrates how inlining works. When we're calling the small function, it's as if V8 writes the contents of the small function into the place it's called from. So when we actually write the contents of a function (even with the extra comment padding), we've manually inlined those operations and the performance is equivalent. Again we can see in V8 5.1 (Node 6) that calling a function that is padded with comments which take it past a certain size, leads to much slower execution.
In Node 8.0-8.2 (V8 5.8) the situation is pretty much the same, except the cost of calling the small function has noticeably increased; this may be due to the smushing together of Crankshaft and Turbofan elements whereas one function may be in Crankshaft the other may be in Turbofan causing disjoints in inlining abilities (i.e. there has to be a jump between clusters of serially inlined functions).
In 5.9 and upwards (Node 8.3+), any size added by irrelevant characters such as whitespace or comments has no bearing on the performance of the function. This is because Turbofan uses the functions AST ( Abstract Syntax Tree node count to determine function size, rather than using character count as in Crankshaft. Instead of checking byte count of a function, it considers the actual instructions of the function, so that from V8 5.9 (Node 8.3+) whitespace, variable name character count, function signatures and comments no longer factors in whether a function will inline. Notably, again, we see that the overall performance of functions decreases.
The takeaway here should still be to keep functions small. At the moment we still have to avoid over-commenting (and even whitespace) inside functions. Also if you want the absolute fastest speed, manually inlining (removing the call) is consistently the fastest approach. Of course, this has to be balanced against the fact that after a certain size (of actual executable code) a function won't be inlined, so copy-pasting code from other functions into your function could cause performance problem. In other words, manual inlining is a potential footgun; it's better to leave inlining up to the compiler in most cases.
32-bit integers vs integers stored in doubles
It's rather well known that JavaScript only has one number type: Number .
However, V8 is implemented in C++ so a choice has to be made on the underlying type for a numeric JavaScript value.
In the case of integers (that is, when we specify a number in JS without a decimal), V8 assumes that all numbers fit into 32 bits - until they don't. This seems like a fair choice since in many cases a number is within the -2147483648 - 2147483647 range. If a JavaScript (whole) number exceeds 2147483647 the JIT Compiler has to dynamically alter the underlying type for the number to a double (a double-precision floating point number) - this may also have a potential knock-on effects with regards to other optimizations.
This benchmark looks at three cases:
- a function handling only numbers in the 32-bit range (sum small)
- a function handling a combination of 32-bit and double numbers (from small to big)
- a function handling only double numbers (all big)
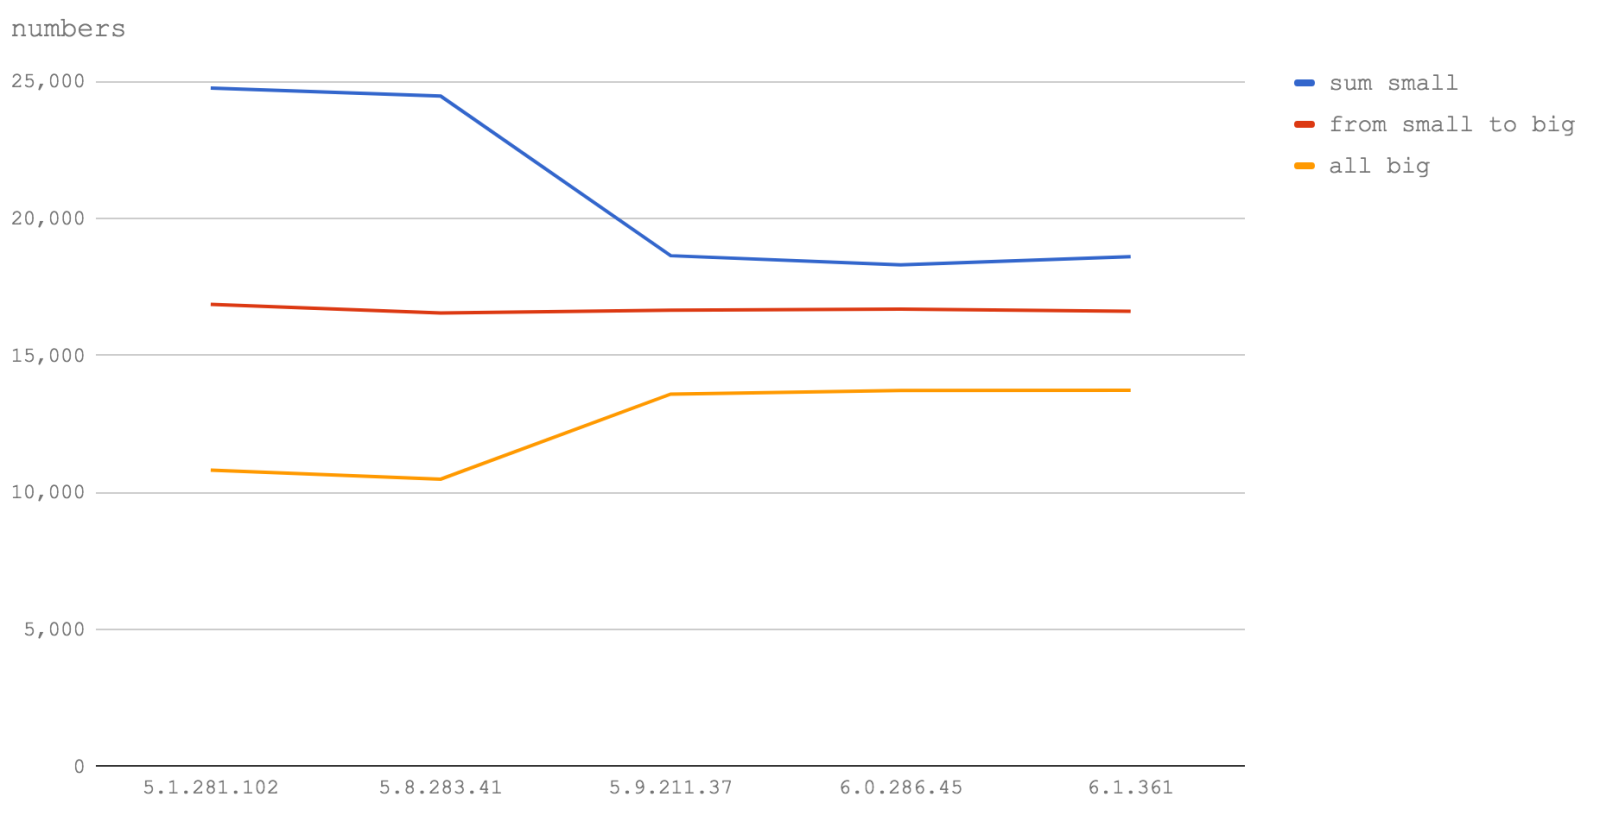
We can see from the graph that whether it's Node 6 (V8 5.1) or Node 8 (V8 5.8) or even some future version of Node this observation holds true. Operations using Numbers (integers) greater than 2147483647 will cause functions to run between a half and two-thirds of the speed.
So, if you have long numeric IDs - put them in strings.
It's also quite noticeable that operations with numbers in the 32-bit range have a speed increase between Node 6 (V8 5.1) and Node 8.1 and 8.2 (V8 5.8) but slow significantly in Node 8.3+ (V8 5.9+). However, operations over double numbers become faster in Node 8.3+ (V8 5.9+). It's likely that this genuinely is a slow-down in (32-bit) number handling rather than being related to the speed of function calls or for loops (which are used in the benchmark code). Edit: updated thanks to Jakob Kummerow and Yang Guo and the V8 team, for both accuracy and precision of the results.
Iterating over objects
Grabbing all of an object's values and doing something with them is a common task and there are many ways to approach this. Let's find out which is fastest across our V8 (and Node) versions.
This benchmark measures four cases for all V8 versions benched:
- using a
for-inloop with ahasOwnPropertycheck to get an object's values (for in) - using
Object.keysand iterating over the keys using the Arrayreducemethod, accessing the object values inside the iterator function supplied toreduce(Object.keys functional) - using
Object.keysand iterating over the keys using the Arrayreducemethod, accessing the object values inside the iterator function supplied toreducewhere the iterator function is a fat arrow function (Object.keys functional with arrow) - looping over the array returned from
Object.keyswith aforloop, accessing the object values within the loop (Object.keys with for loop)
We also benchmark an additional three cases for V8 5.8, 5.9, 6.0 and 6.1
- using
Object.valuesand iterating over the values using the Arrayreducemethod, (Object.values functional) - using
Object.valuesand iterating over the values using the Arrayreducemethod, where the iterator function supplied toreduceis a fat arrow function (Object.values functional with arrow) - looping over the array returned from
Object.valueswith aforloop (Object.values with for loop)
We don't bench these cases in V8 5.1 (Node 6) because it doesn't support the native EcmaScript 2017 Object.values method. Code: https://github.com/davidmarkclements/v8-perf/blob/master/bench/object-iteration.js
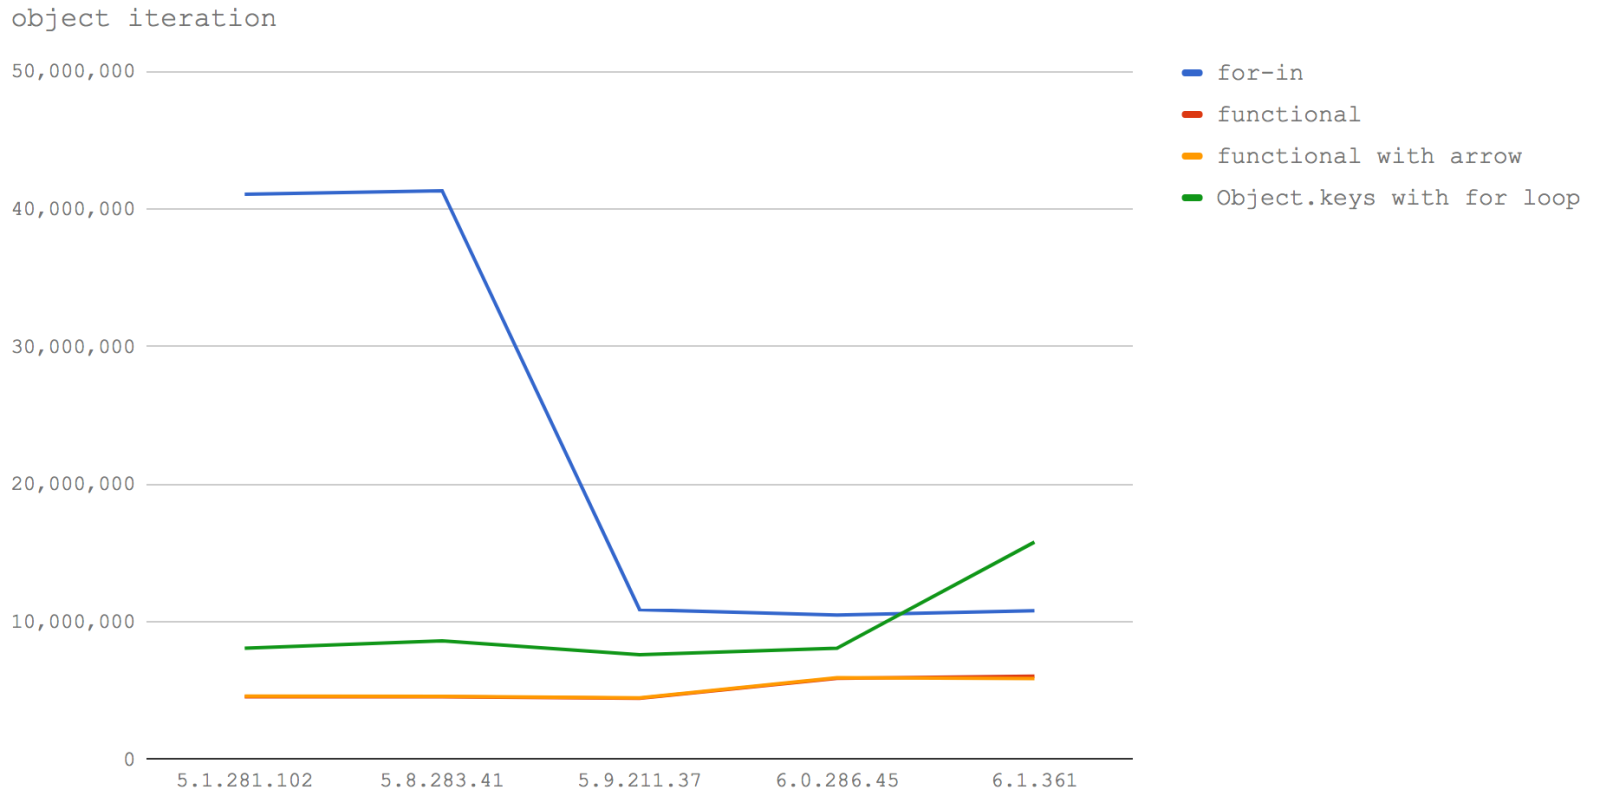
In Node 6 (V8 5.1) and Node 8.0-8.2 (V8 5.8) using for - in is by far the fastest way to loop over an object's keys, then access the values of the object. At roughly 40 million operations per second, it's 5 times faster than the next closest approach which is Object.keys at around 8 million op/s.
In V8 6.0 (Node 8.3) something happens to for - in and it cuts down to one quarter the speed of former versions, but is still faster than any other approach.
In V8 6.1 (the future of Node), the speed of Object.keys leaps forward and becomes faster than using for - in - but no where near the speed of for - in in V8 5.1 and 5.8 (Node 6, Node 8.0-8.2).
A driving principle behind Turbofan seems to be to optimize for intuitive coding behavior. That is, optimize for the case that is most ergonomic for the developer.
Using Object.values to get values directly is slower than using Object.keys and accessing the values in the object. On top of that, procedural loops remain faster than functional programming. So there may be some more work to do when it comes to iterating over objects.
Also, for those who've used for - in for its performance benefits it's going to be a painful moment when we lose a large chunk of speed with no alternative approach available. Note: the for-in loops performance has been fixed in V8, see https://benediktmeurer.de/2017/09/07/restoring-for-in-peak-performance/ for more details. This change will likely be integrated by Node 9.
Object allocation
We allocate objects all the time so this is a great area to measure.
We're going to look at three cases:
- allocating objects using object literals (literal)
- allocating objects from an EcmaScript 2015 Class (class)
- allocating objects from a constructor function (constructor)
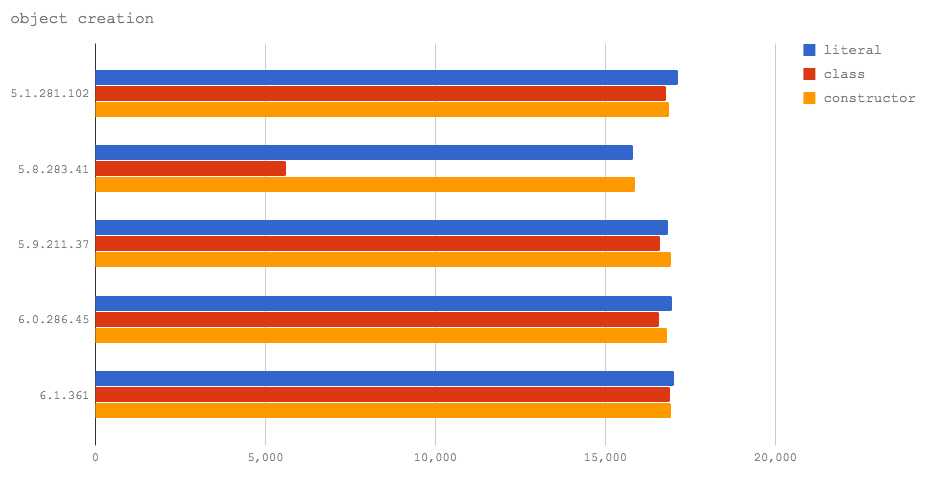
Object allocation has the same cost in all the test V8 versions, apart from classes in Node 8.2 (V8 5.8), which are slower than the rest. This is due to the mixed Crankshaft/Turbofan nature of V8 5.8, and it will be resolved in Node 8.3 with V8 6.0. Edit: Jakob Kummerow noted in https://disq.us/p/1kvomfk that Turbofan can optimize away the object allocation in this specific microbenchmark, leading to incorrect results so this article has been edited accordingly.
Object allocation elimination
While collating our results for this article, we came across a really neat optimization that Turbofan brings to a certain category of object allocation. Originally we mistook this for all object allocation, but thanks to input from the V8 team we've come to understand the circumstances which this optimization relates to.
In the previous Object allocation benchmarks, we assign a variable, set it to null and then reassign the variable a bunch of times to avoid triggering the special optimization case which we're going to look at now.
In this benchmark we look at three cases:
- allocating objects using object literals (literal)
- allocating objects from an EcmaScript 2015 Class (class)
- allocating objects from a constructor function (constructor)
However, the difference is, the reference to the object is not overwritten with additional object allocations, and the object is passed to another function which performs a task on the object.
Let's take a look at the results!
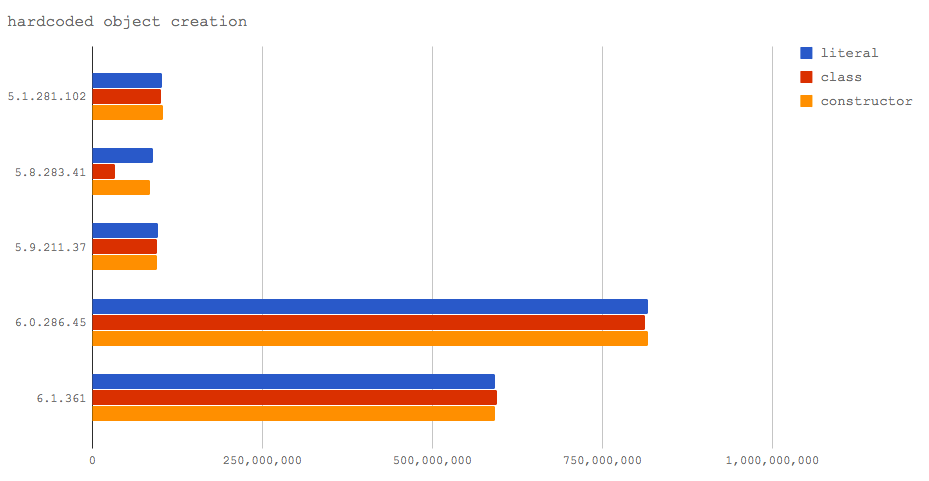
Notice how V8 6.0 (Node 8.3) and 6.1 (Node 9) yield a massive jump in speed for this case, over 500 million operations per second, mainly because nothing is really happening once Turbofan applies the optimization. In this particular scenario, Turbofan is able to optimize away the object allocation because it's able to determine that subsequent logic can be executed without requiring the existence of the actual object.
The benchmark code still doesn't fully demonstrate what it takes to trigger this optimization (because it's more about what's not there than what is) and the conditions it takes for this optimization to be applied are complex.
However, one condition which we know will definitely not allow for the object to be optimized away by Turbofan is as follows:
The object must not outlive the function it was created in. That means, there should be no reference to that object after every function from that point in the stack has completed. The object can be passed to other functions, but if we add that object to a this context, or assign it to an outer scoped variable, or add it to another object that lives on after the stack has finished the optimization cannot be applied.
The ramifications for this could be pretty cool, however, it's difficult to predict all the conditions where such an optimization occurs. Nevertheless, it may yield useful speedups when the complex set of conditions are met. Edit: Thanks to Jakob Kummerow and the rest of the V8 team for helping us discover the underlying reasons for this particular behaviour. As part of this research, we discovered a performance regression in the new GC of V8, Orinoco. if you are interested checkout https://v8project.blogspot.it/2016/04/jank-busters-part-two-orinoco.html and https://bugs.chromium.org/p/v8/issues/detail?id=6663
Polymorphic vs monomorphic code
When we always pass the same type of argument into a function (say, we always pass a string), we are using that function in a monomorphic way.
Some functions are written to be polymorphic. We can think of a polymorphic function as a function that accepts different types in the same argument position . For instance, a function may accept either a string or an object as its first argument. However in this context when we say "type", we don't just mean string versus number versus object, we mean object shape (although JavaScript types actually count as different object shapes as well)
The shape of an object is defined by its properties and values. For instance, in the following snippet, obj1 and obj2 are the same shape but obj3 and obj4 are different shapes to the rest:
const obj1 = { a: 1 }
const obj2 = { a: 5 }
const obj3 = { a: 1, b: 2 }
const obj4 = { b: 2 }
Processing objects with different shapes through the same code can make for nice interfaces in some circumstances but tends to have a negative impact on performance.
Let's see how monomorphic and polymorphic cases do in our benchmarks.
Here we investigate two cases:
- a function where we process objects with different properties (
polymorphic) - a function where we process objects with the same properties (
monomorphic)
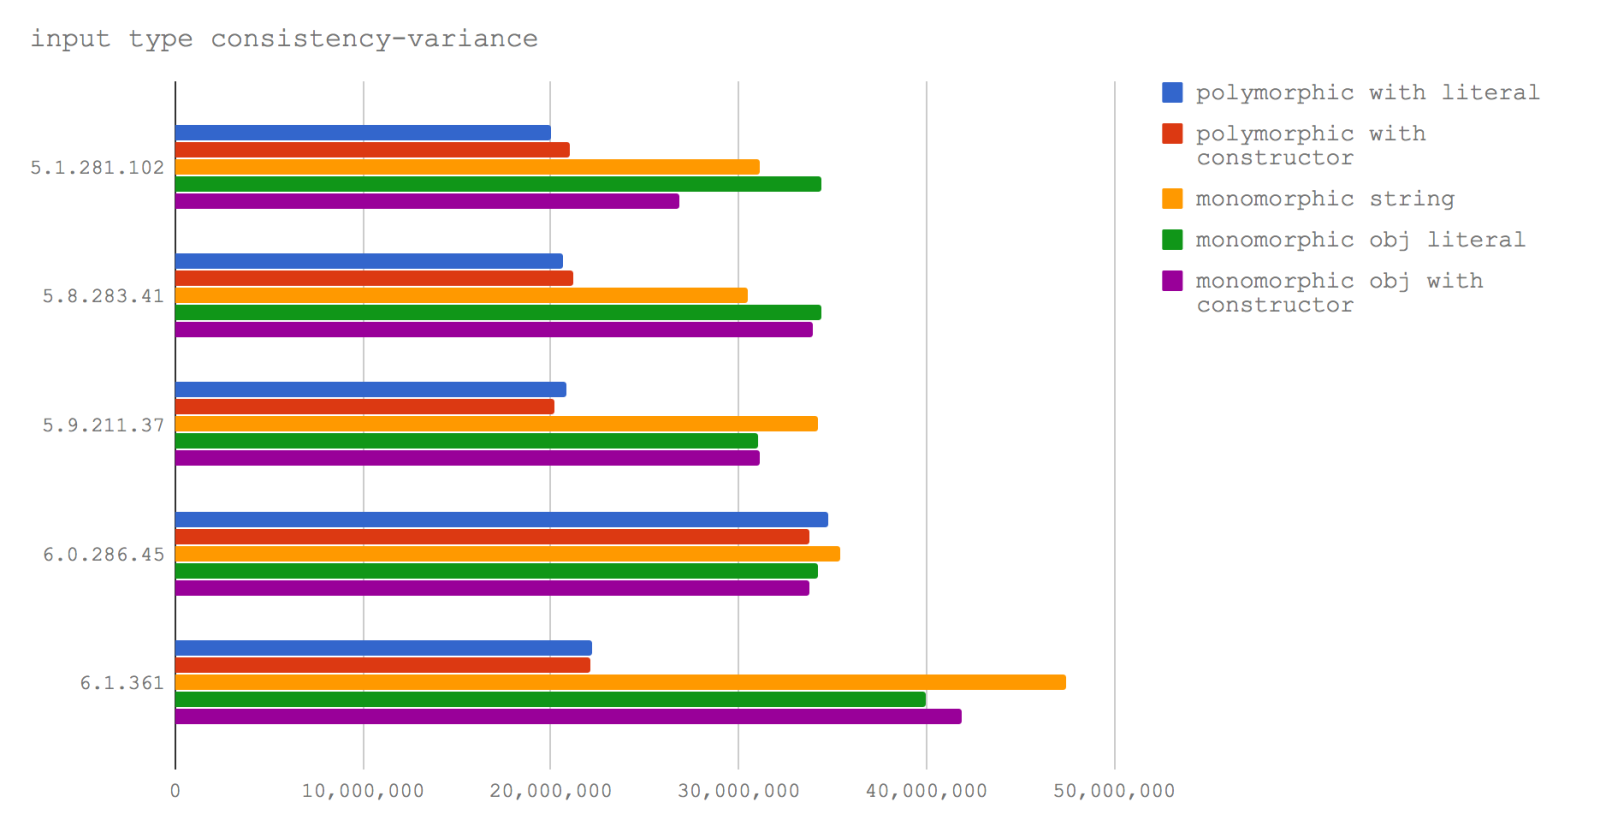
The data visualized in our graph shows conclusively that monomorphic functions outperform polymorphic functions across all V8 versions tested. However, the performance of the polymorphic function improves from V8 5.9+ (which means it improves from Node 8.3 which uses V8 6.0).
Polymorphic functions are very common through the Node.js codebase, and they provide a great deal of flexibility through the APIs. Thanks to this improvement around polymorphic interaction, we may see a degree of improved performance in more complex Node.js applications.
If we're writing code that needs to be optimal, that is a function that will be called many times over, then we should commit to call functions with the parameters with the same "shape". On the other hand, if a function is only called once or twice, say an instantiating/setup function, then a polymorphic API is acceptable. Edit: Thanks Jakob Kummerow for providing a more reliable version of this benchmark.
The debugger keyword
Finally, let's talk about the debugger keyword.
Be sure to strip debugger statements from your code. Stray debugger statements destroy performance.
We're looking at two cases:
- a function that contains the
debuggerkeyword (with debugger) - a function that does not contain the
debuggerkeyword (without debugger)
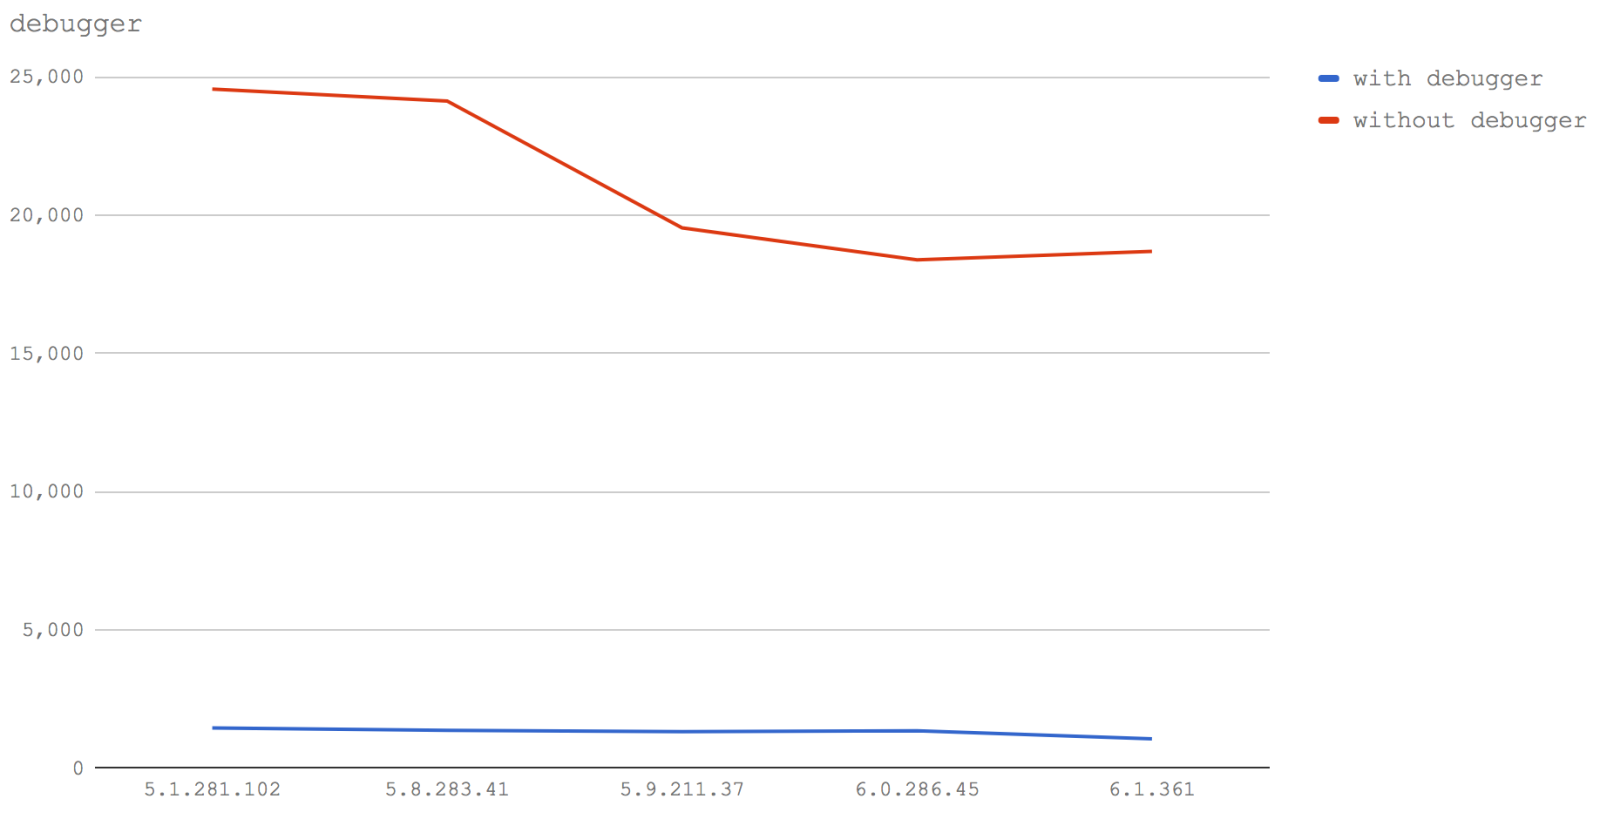
Yep. Just the presence of the debugger keyword is terrible for performance across all V8 versions tested.
The without debugger line noticeably drops over successive V8 versions, we'll talk about this in the Summary .
A real-world benchmark: Logger comparison
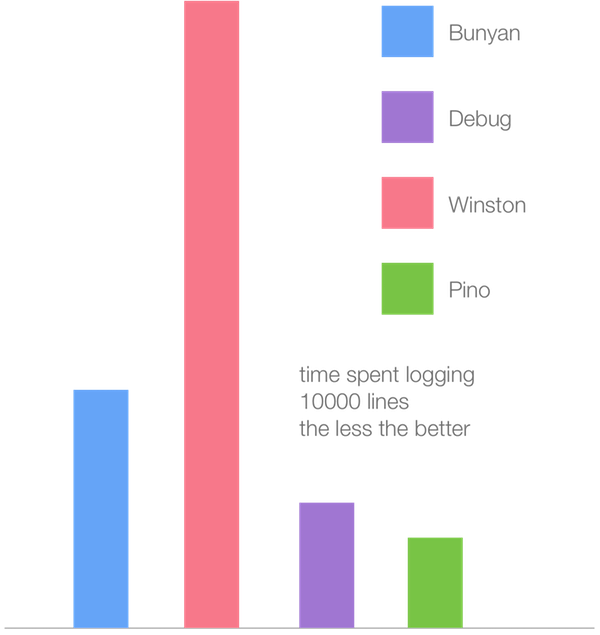
In addition to our microbenchmarks, we can take a look at the holistic effects of our V8 versions by using benchmarks of most popular loggers for Node.js that Matteo and I put together while we were creating Pino .
The following bar chart represents the time taken to log 10 thousand lines (lower is better) of the most popular loggers in Node.js 6.11 (Crankshaft):
While the following is the same benchmarks using V8 6.1 (Turbofan):
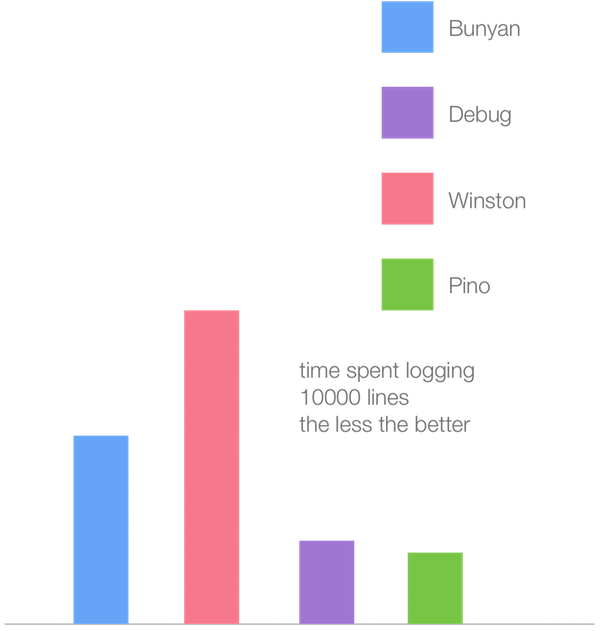
While all of the logger benchmarks improve in speed (by roughly 2x), the Winston logger derives the most benefit from the new Turbofan JIT compiler. This seems to demonstrate the speed convergence we see among various approaches in our microbenchmarks: the slower approaches in Crankshaft are significantly faster in Turbofan while the fast approaches in Crankshaft tend to get a little slower Turbofan. Winston, being the slowest, is likely using the approaches which are slower in Crankshaft but much faster in Turbofan whereas Pino is optimized to use the fastest Crankshaft approaches. While a speed increase is observed in Pino, it's to a much lesser degree.
Summary
Some of the benchmarks show that while slow cases in V8 5.1, V8 5.8 and 5.9 become faster with the advent of full Turbofan enablement in V8 6.0 and V8 6.1, the fast cases also slow down, often matching the increased speed of the slow cases.
Much of this is due to the cost of making function calls in Turbofan (V8 6.0 and up). The idea behind Turbofan was to optimize for common cases and eliminate commonly used "V8 Killers". This has resulted in a net performance benefit for (Chrome) browser and server (Node) applications. The trade-off appears to be (at least initially) a speed decrease for the most performant cases. Our logger benchmark comparison indicates that the general net effect of Turbofan characteristics is comprehensive performance improvements even across significantly contrasting code bases (e.g. Winston vs Pino).
If you've had an eye on JavaScript performance for a while, and adapted coding behaviours to the quirks of the underlying engine it's nearly time to unlearn some techniques. If you've focused on best practices, writing generally good JavaScript then well done, thanks to the V8 team's tireless efforts, a performance reward is coming.
This article was co-written by David Mark Clements and Matteo Collina , and it was reviewed by Franziska Hinkelmann and Benedikt Meurer from the V8 team.
All the source code and another copy of this article could be found at https://github.com/davidmarkclements/v8-perf The raw data for this article can be found at: https://docs.google.com/spreadsheets/d/1mDt4jDpN_Am7uckBbnxltjROI9hSu6crf9tOa2YnSog/edit?usp=sharing Most of the microbenchmarks were taken on a MacBook Pro 2016, 3.3 GHz Intel Core i7 with 16 GB 2133 MHz LPDDR3, others (numbers, property removal, polymorphic, object creation) were taken on a MacBook Pro 2014, between the different Node.js versions were taken on the same machine. We took great care in assuring that no other programs were interfering. Will O
Insight, imagination and expertly engineered solutions to accelerate and sustain progress.
Contact