How to Self Detect a Memory Leak in Node
Updated and republished by Dara Hayes on May 24 2017 Tracking down memory leaks with Node.js has always been a challenge. The following discusses how to track memory leaks in a Node application using Nodes --inspect flag and the two awesome node modules memwatch and heapdump .

First, a trivial sample leak:
const http = require('http');</p><p>var server = http.createServer((req, res) => {
 for (var i=0; i<1000; i++) {
 server.on('request', function leakyfunc() {});
 }</p><p> res.end('Hello World\n');
}).listen(1337, '127.0.0.1');
server.setMaxListeners(0);</p><p>console.log('Server running at https://127.0.0.1:1337/. Process PID: ', process.pid);
Every request adds another 1,000 leaky listeners. We are going to simulate requests using autocannon – A HTTP benchmarking tool written in node. It can be installed with npm i -g autocannon . If we run autocannon -c 1 -d 60 https://localhost:1337 in one shell, and in another shell view our process: top -pid we will see very high and erratic memory usage for this node process. Our node process has gone wild. So how do you diagnose from here?
Memory leak detection
The memwatch-next module is great for detecting memory leaks. Lets install into our app as follows: npm install --save memwatch-next . Then, in our code, add:
const memwatch = require('memwatch-next');and also a listener for the leak event:
memwatch.on('leak', (info) => {
  console.error('Memory leak detected:\n', info);
});
Now when we run our test again, we see the following emitted:
Memory leak detected:
{
  growth: 14280616,
  reason: 'heap growth over 5 consecutive GCs (3s) - -2147483648 bytes/hr'
}
Memwatch has detected a memory leak! Memwatch defines a leak event as:
“‘A leak event will be emitted when your heap usage has increased for five consecutive garbage collections.’”
See memwatch for more details.
Memory leak analysis
So weve detected that we have a memory leak great! But what now? The next step is to find where your leak is. The example leak is pretty obvious, but the process for finding one is always the same:
- Create heap dumps at different time intervals.
- Compare the dumps to see whats growing.
Lets see two ways of doing this.
Node’s –inspect Flag
Nodes --inspect flag landed in node version 6. This feature lets you debug and inspect your node process from within Chromes DevTools . Simply start the application passing the --inspect flag:
$ node --inspect index.js
Debugger listening on port 9229.
Warning: This is an experimental feature and could change at any time.
To start debugging, open the following URL in Chrome:
    chrome-devtools://devtools/bundled/inspector.html?experiments=true&v8only=true&ws=127.0.0.1:9229/9fe96182-d16e-4028-9e17-3c1d20d8398a
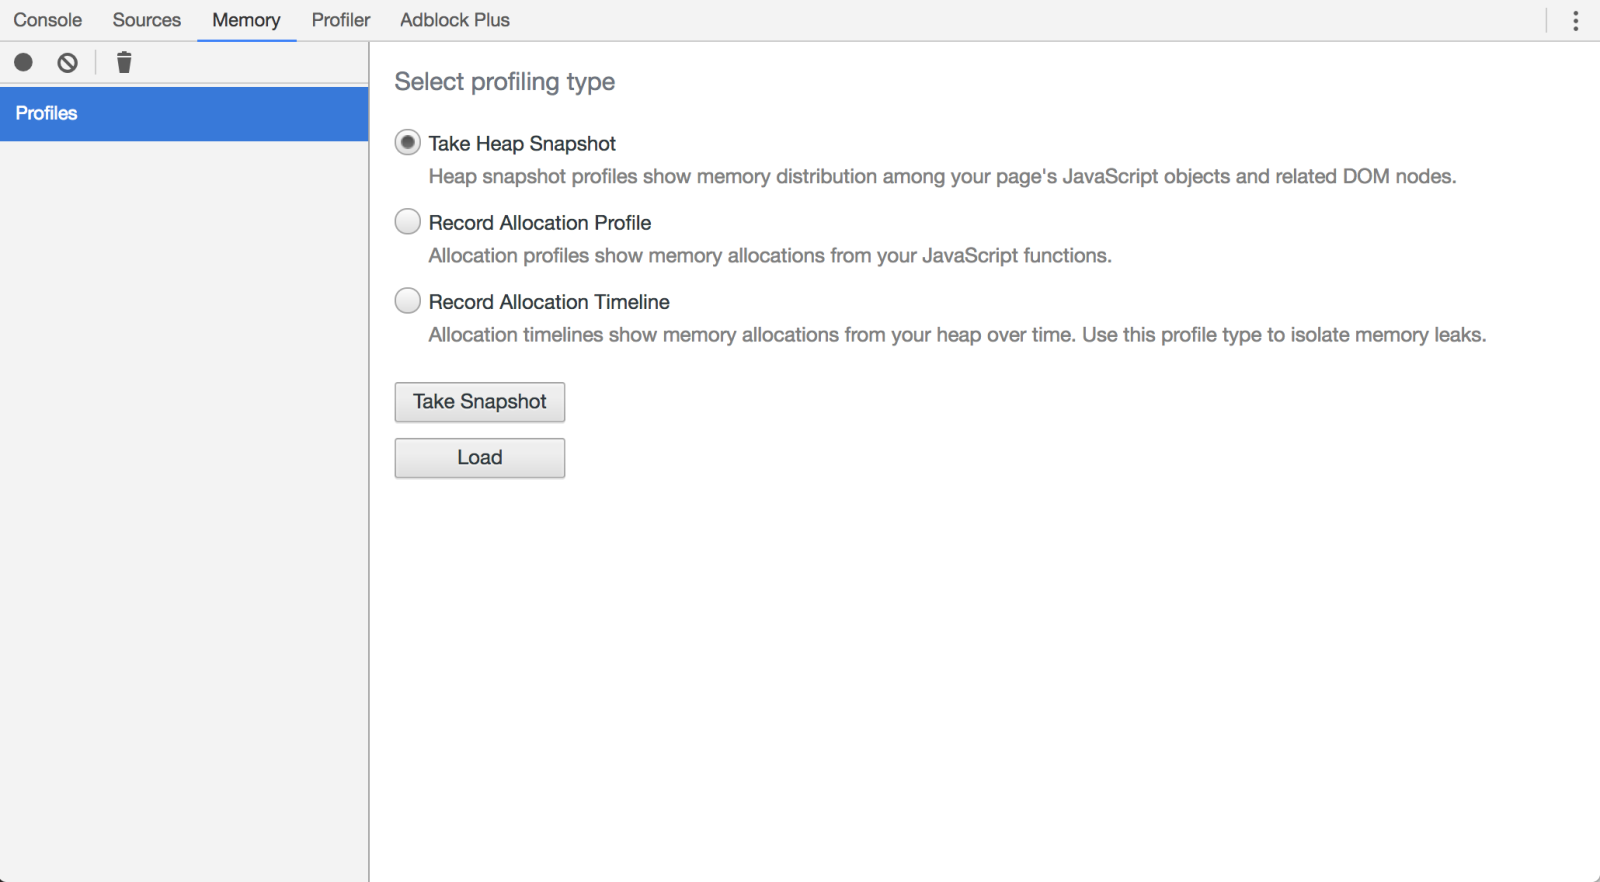
Follow the URL to the inspector and navigate to the memory tab.

DevTools Memory Tab Heres what we will do:
- Hit the application with
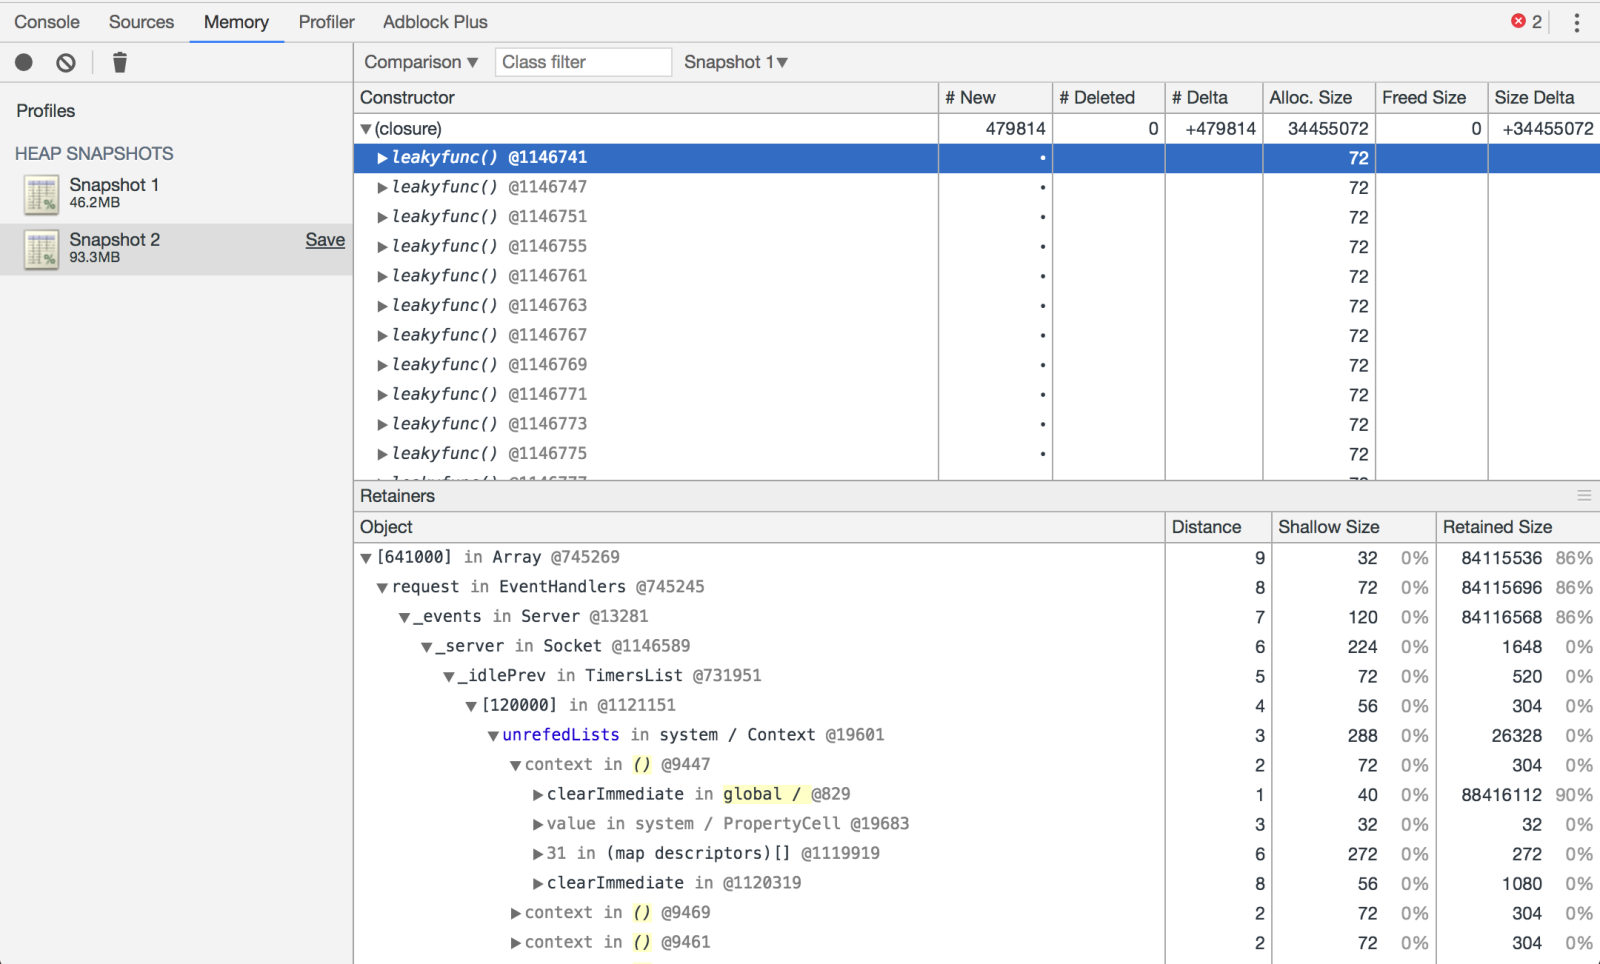
autocannon -c 1 -d 60 https://localhost:1337 - Take a heap snapshot after roughly 10 seconds, and again after 30 seconds.

Heap Snapshot Comparison The comparison view shows us what has happened between snapshots. We can see a huge number of closure objects have been created. The delta columns also give us an idea of how much growth there has been. Lets take a deeper look:

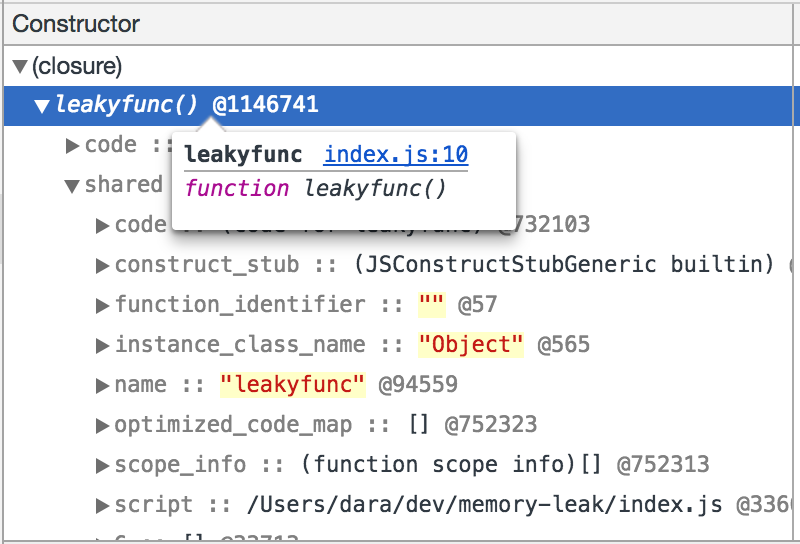
Found our Memory Leak Now it is clear that our leakyfunc() is the root of the problem. The Retainers view shows where the reference to our leakyfunc() object is held in memory. We can also find exactly where it was created in our code.

Memory Leak Details For a great overview of memory profiling in DevTools, see Taming The Unicorn: Easing JavaScript Memory Profiling In Chrome DevTools .
Heapdump
node-heapdump is a great module. If the --inspect option is not available, or you need to create snapshots programmatically, heapdump can be used to create a snapshot from within the application code. For more on heapdump, see the following StrongLoop blog post . Let’s use heapdump in our code now, so that every time a memory leak is detected, we write out a snapshot of the V8 stack to disk:
memwatch.on('leak', (info) => {
  console.error('Memory leak detected:\n', info);
  heapdump.writeSnapshot((err, filename) => {
    if (err) console.error(err);
    else console.error('Wrote snapshot: ' + filename);
})
Run our test again, and you should see some ‘.heapsnapshot’ files created in our application folder. Now in Chrome, launch DevTools (alt-cmd-i on Mac), hit the Memory tab and hit Load to load in our snapshots. Now we can find the leak as we did in the previous section.
Concluding observations
The above outlines one method of ‘self detecting’ memory leaks in Node and these are my concluding observations:
- heapdump has some caveats about snapshot size, etc. Read the fine print carefully. It's also CPU intensive to take a snapshot.
- There are other ways of generating snapshots with heapdump. Pick whichever way suits your application best, e.g. sending sigusr2 to the process, etc. This is also possible with memwatch-sigusr2.
- Consider where and when you enable memwatch/heapdump. Only enable in testing and not in production. Also, consider how many heapdumps to write out before possibly bailing out of the process. Again, do whatever best suits your application.
- Consider the other ways of detecting memory growth from within your application, i.e. monitoring the size of process.memoryUsage().rss as an alternative to memwatch.
- When a memory leak is detected, you should also make sure it gets picked up by your monitoring and alerting tools so humans are told about it.
- Beware of false positives: short memory spikes can appear as leaks to memwatch. If your app suddenly gets busy and uses a big chunk of memory which it takes a while to process, this processing time can span multiple garbage collections and memwatch will report a leak. However, there may be nothing wrong here per se. When your app is done processing, the memory usage should settle down again. What you’re really looking for is persistent reporting of memory leaks. One-off ‘blips’ may actually be ok.
The gist for source code referred to in this article can be found here . Having trouble with detecting memory leaks in node.js or want to know more on self-detection of memory leaks? You can tweet me or connect with me on LinkedIn .
If you’d like to know more about how NearForm can help you, contact us here
Insight, imagination and expertly engineered solutions to accelerate and sustain progress.
Contact