Tuning Node.js app performance with Autocannon and 0x
Improving your Node.js app's performance
Featuring two open source tools developed by Matteo Collina and David Mark Clements of NearForm.
Performance improvements either on a database or a web app require good tools. They should be easy to use and help you identify the issue quickly.
In this post, I am going to introduce two tools developed at NearForm that do just that to help improve your Node.js Web App. Then we will troubleshoot a RESTful API.
The Tools

Autocannon is an HTTP/1.1 benchmarking tool developed by our very own Matteo Collina . It is written in Node.js and can work on Linux, Mac, and Windows. It supports HTTP and HTTPS.

To install globally run:
npm -i autocannon -g
0x ( pronounced zero ex ) was written by our very own David Mark Clements .
It will profile and generate an interactive flame graph for a Node.js process in a single command. It works on Linux and Mac

To install globally:
npm -i 0x -gNode.js Version
In this post, we are going to target Node.js version 6.
Using Node.js Version Manager , run the commands below:
nvm install v6
nvm use v6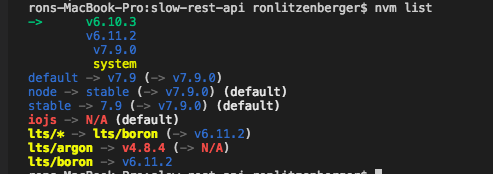
Setup App
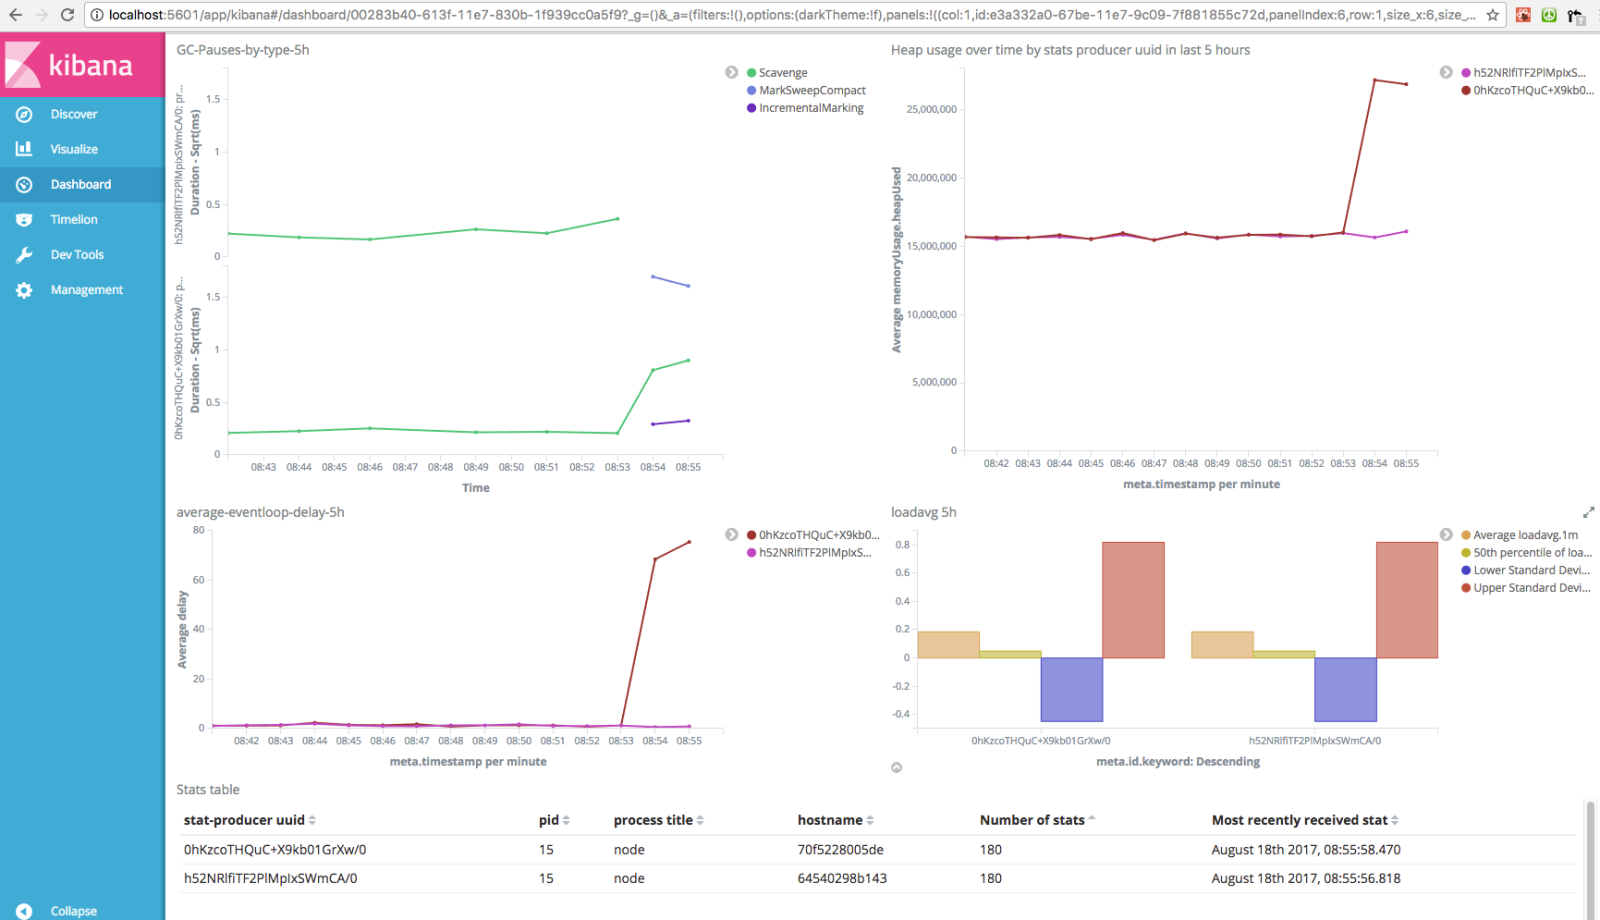
We are going to use our Slow Rest API to demo both autocannon and 0x. From our previous post, Building a real-time dashboard , we know there is a bottleneck based on the Kibana dashboard below, and in this post, we'll dive into what we can find.
To setup:
git clone https://github.com/nearform/slow-rest-api.git
cd slow-rest-api
node index
In another terminal: npm test
Generating a flame graph
We need to make sure we're using either Linux or Mac and we have super user access since it uses dtrace or perf.0x index. 0x may ask us for sudo access, this is necessary since the underlying tracing tool (dtrace on Mac or perf on Linux) requires root access. In another terminal, as soon as possible, we run: npm test .
We can now hit CTRL-C in the first terminal where we ran 0x.
The 0x process will begin to generate the flame graph in the form of an HTML file and then provide the link to that file.
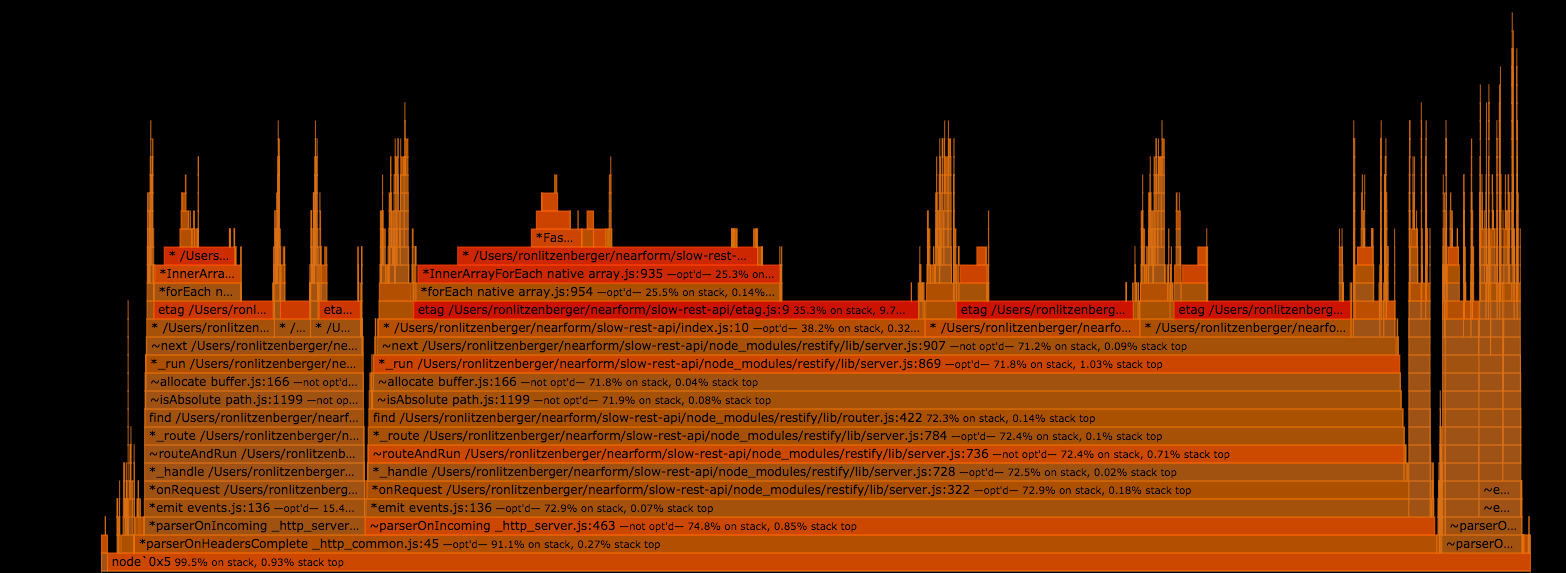
When we copy this link into a browser we should see a flame graph similar to the following:
Reading Flame Graphs:
Each box in the graph represents a function and the different colors represents the amount of time the function is on CPU.
A dark red box is a hot function which represents more time was observed on top of stack which would be blocking the event loop. We will then follow the child functions below to see the code path that was taken.
Troubleshoot a performance issue:

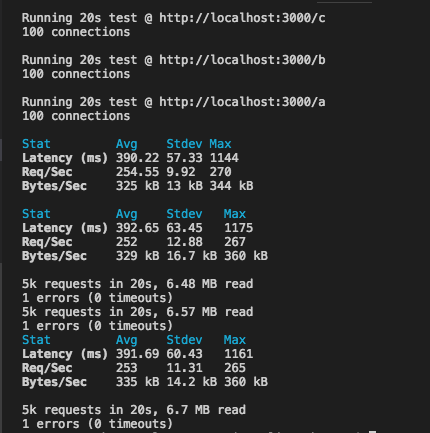
When we run npm test, we are using autocannon to add load to the server.
The script looks like this: autocannon -d 20 -c 100 https://localhost:3000/a & autocannon -d 20 -c 100 https://localhost:3000/b & autocannon -d 20 -c 100 https://localhost:3000/c From our demo above, we see the request per sec is at 252.
Let's see if we can improve the Req/Sec.

Now let's take a look at the frame graph.
The reddest box at the top points to etag.js line 23 which is reading through a cache object using the Array forEach method:

We can use the flame graphs to follow the code path.
In the above graph, we see the route https://localhost:3000/a from our autocannon is the slowest.
So from here we can troubleshoot that route and follow it to determine our fix to the bottleneck.
Since the forEach is a hot point in our flame graph, lets rewrite it using a for loop to see if that improves performance.
Lets rewrite the loop as follows:

After running autocannon on the change, we see our Requests have improved to 386 on average and throughput 507 kb per sec which is better but still not great.

While this is better, we still see that request to the /a route is still hot, causing a bottleneck in the app.
Following the code path we also see the Buffer.from and Buffer.toString are also red.
Lets try to remove the cache and see what happens.
Now when we run autocannon, we get a big improvement on Requests per second.
It is now at 1867 on average compared to the initial run of 254.
Our throughput is 2.59 MB per second on average.

And our flame graph looks like this:
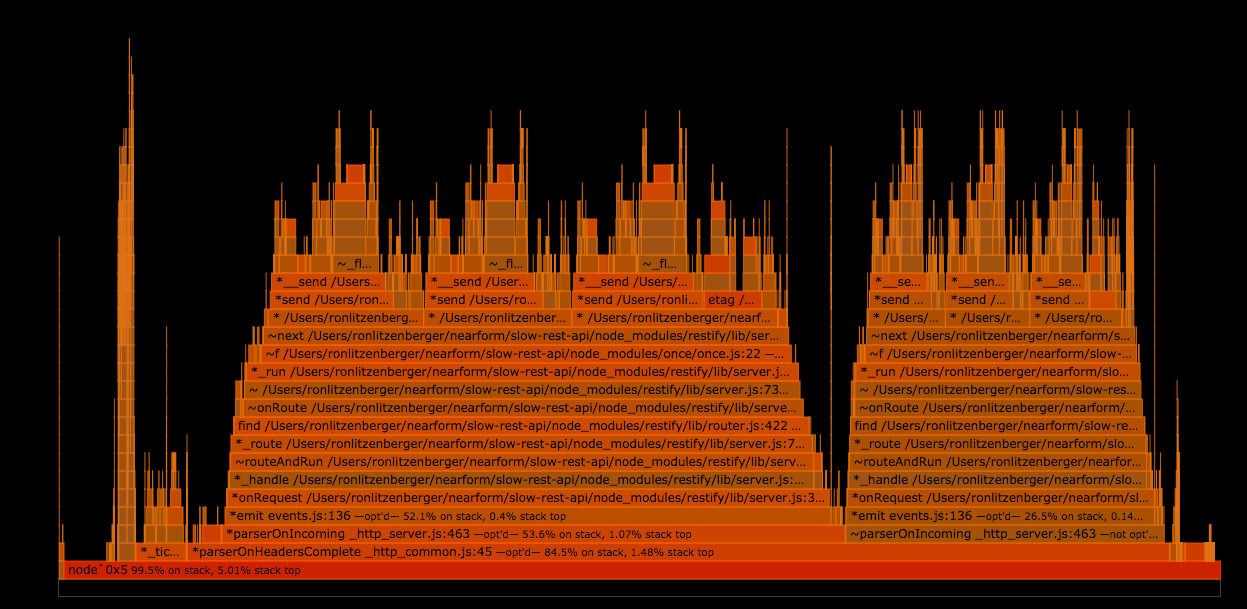
By removing the etagCache check and generating the etag each time, we have shown this is better for performance.
The reason is due to the synchronous forEach, for loop, and using Buffer.from and Buffer.toString() in our cache object which all showed up as red in our flame graph.
We are also reading in a large JSON file each time we check the cache. It is an unnecessary optimization that did not take into account the size that the cache could become later (usually in production), causing a bottleneck.
Typically, implementing cache gives your application better performance but since this was poorly implemented. Using caching slowed down the performance and the fix was to remove the cache.
In our case, the poorly implemented cache caused the bottleneck. It is also worth noting that adding a cache is ideal.
It's better to go higher on the stack using something like Nginx which specializes in caching.
We have shown how to use autocannon to easily add load to your app and 0x to visualize the stack trace to identify potential bottlenecks in the event loop.
These easy to use tools can help you measure your app performance and visually find bottlenecks.
NearForm Open Source Repos:
AutoCannon: https://github.com/mcollina/autocannon 0x: https://github.com/davidmarkclements/0x Slow Rest API: https://github.com/nearform/slow-rest-api
Insight, imagination and expertly engineered solutions to accelerate and sustain progress.
Contact