


The ability to collect, analyze, triangulate and visualize vast amounts of data in real time is something the human race has never had before.
- Rick Smolan
After pushing out webpack-dashboard and seeing how much people enjoy terminal-based tooling, I thought perhaps I should see what else I can explore in this space.
Formidable’s ReactJS-based data visualization library Victory seemed like an awesome candidate for a command-line render target. I saw a project, hyperchart, by Matthew Conlen, that allowed users to generate interactive Victory charts into hyperterm-window.
This looked awesome, but I was looking for a way to expand the feature set and operate in a broader range of TERMs. I had also seen some ASCII/ANSI style visualizations in blessed-contrib while building webpack-dashboard, and they seemed super cool. However, porting would be too much of a challenge given the differences in APIs. Of course, ASCII/ANSI style charts didn’t seem practical for the mainstream use case.
Then I realized something: Victory outputs valid SVG markup. This, coupled with ReactDOM.renderToString, actually makes command-line chart generation really easy. I got to work on it, and today I’m happy to announce the initial release of Victory CLI!
Victory CLI is an easy-to-use command-line interface for generating and displaying Victory-based data visualizations. It can:
- Render a variety of chart types
- Use built-in themes
- Render to PNG
- Render to SVG
- Display PNG renders in iTerm3
- Take a custom JSON data input
- Take a custom component script input to render from
Check it out in action:
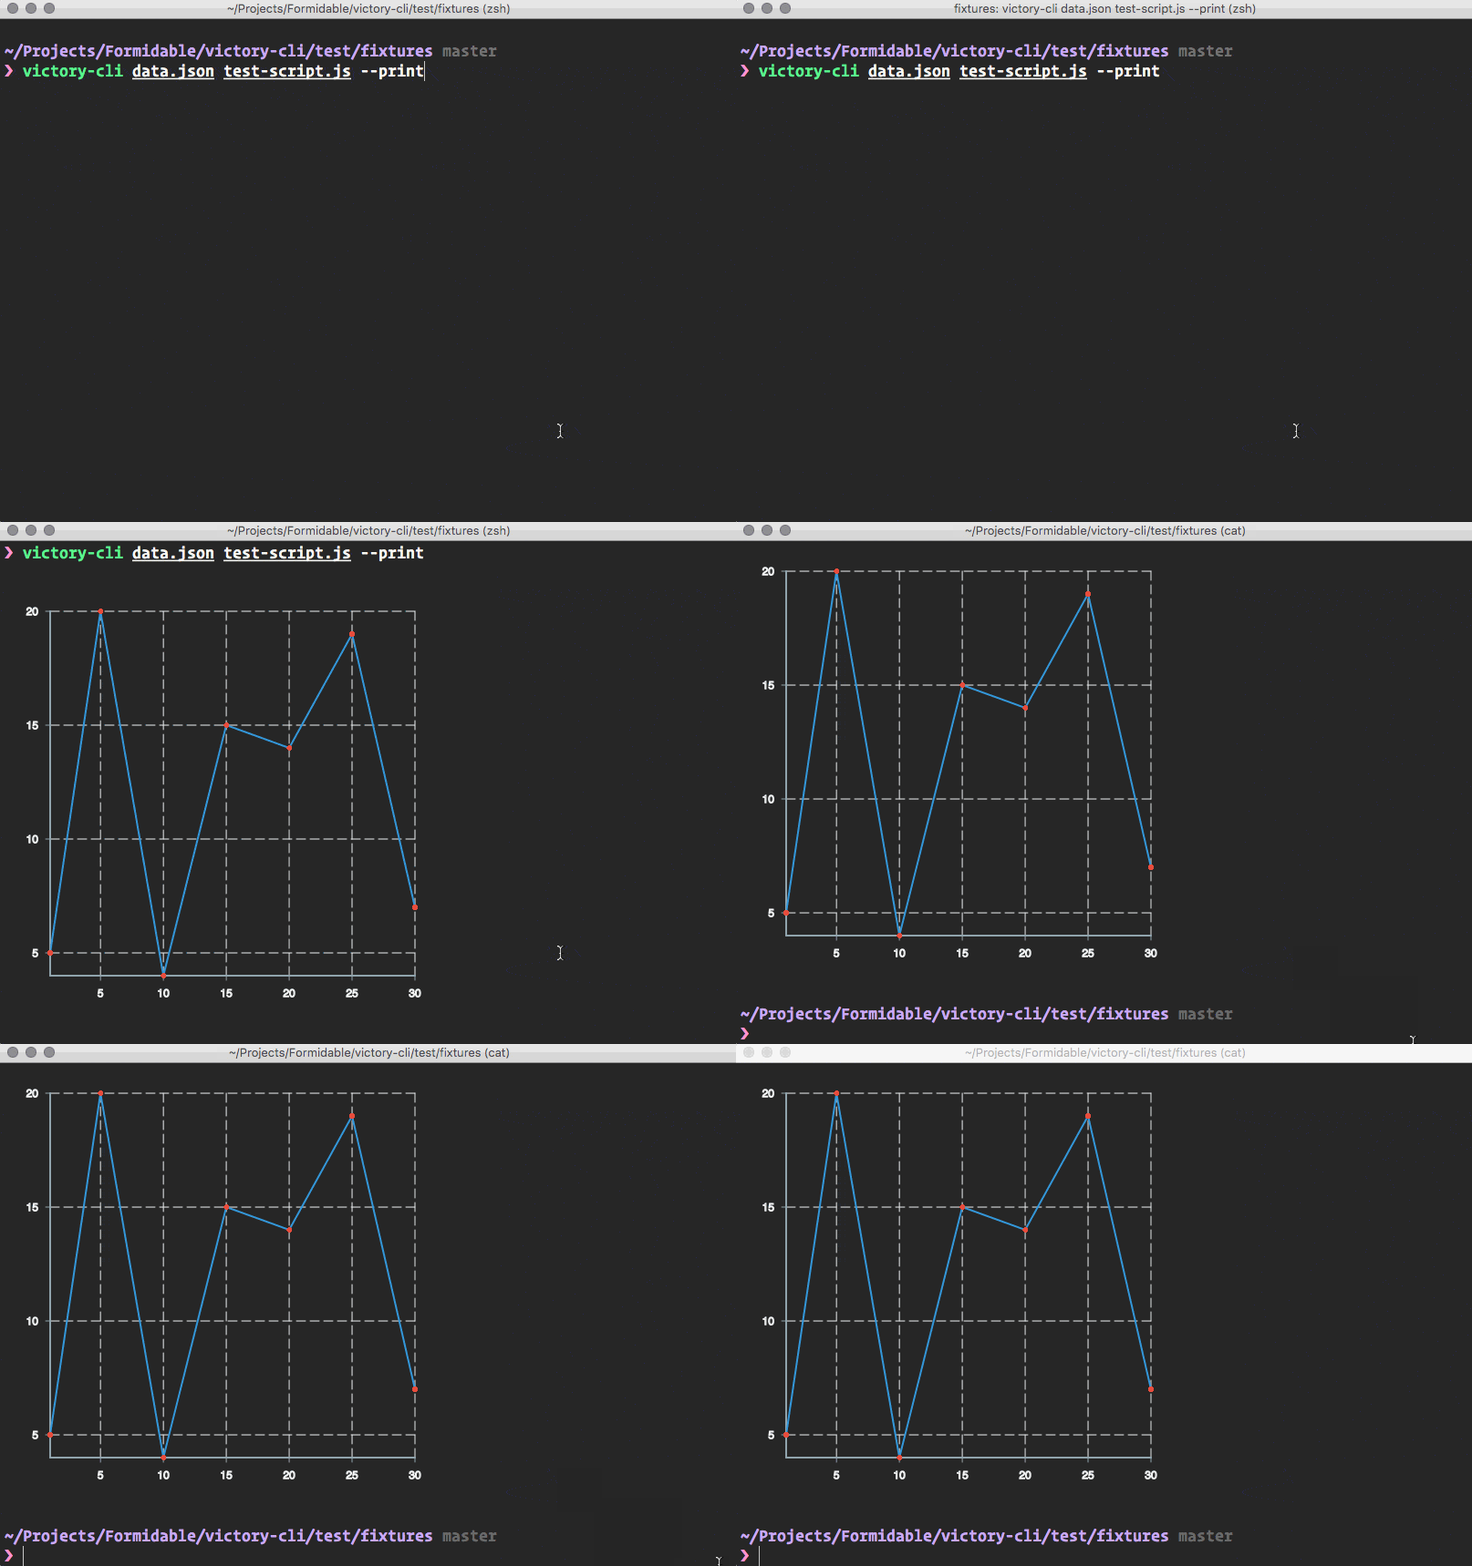
If you think this is cool and want to give it a try, just npm install -g victory-cli and head over to https://github.com/FormidableLabs/victory-cli to get started!