Observability lessons: Exploring your Alloy+Grafana Cloud setup
We explore a new feature of Grafana Cloud, Grafana Labs’ observability platform
Working as a DevOps Engineer in Nearform, with a specialisation in observability, I’m often faced with behaviours that are seemingly in conflict with documentation or just user expectations. A common example is something not working even if its configuration matches the documented example or procedure. This may lead to incomplete results, incorrect data, a process not starting, unexpected warnings or errors during configuration load.
Finding a reason for and solution to those behaviours can be fun or, at times, challenging. This article explores an example related to a new feature of Grafana Cloud, Grafana Labs’ observability platform.
Using Alloy to send telemetry data to Grafana Cloud
Application Observability is the solution provided by Grafana Cloud to get value from the OpenTelemetry instrumentation (manual or automatic) of your application.
It comes with useful dashboards that show RED metrics (requests rate, errors, duration) as a starting point to troubleshoot errors and performance issues, eventually drilling down into other telemetry data (for example logs and traces).
There are many ways to send telemetry data to Grafana Cloud but we’ll focus on Alloy, Grafana Labs’ new shipping tool based on the OpenTelemetry collector code. It receives metrics, logs and traces from your application and has the ability to apply many different pipeline blocks to enhance, filter and batch all telemetry data before finally sending them to the remote Grafana Cloud endpoint — in this case, using the otlp protocol.
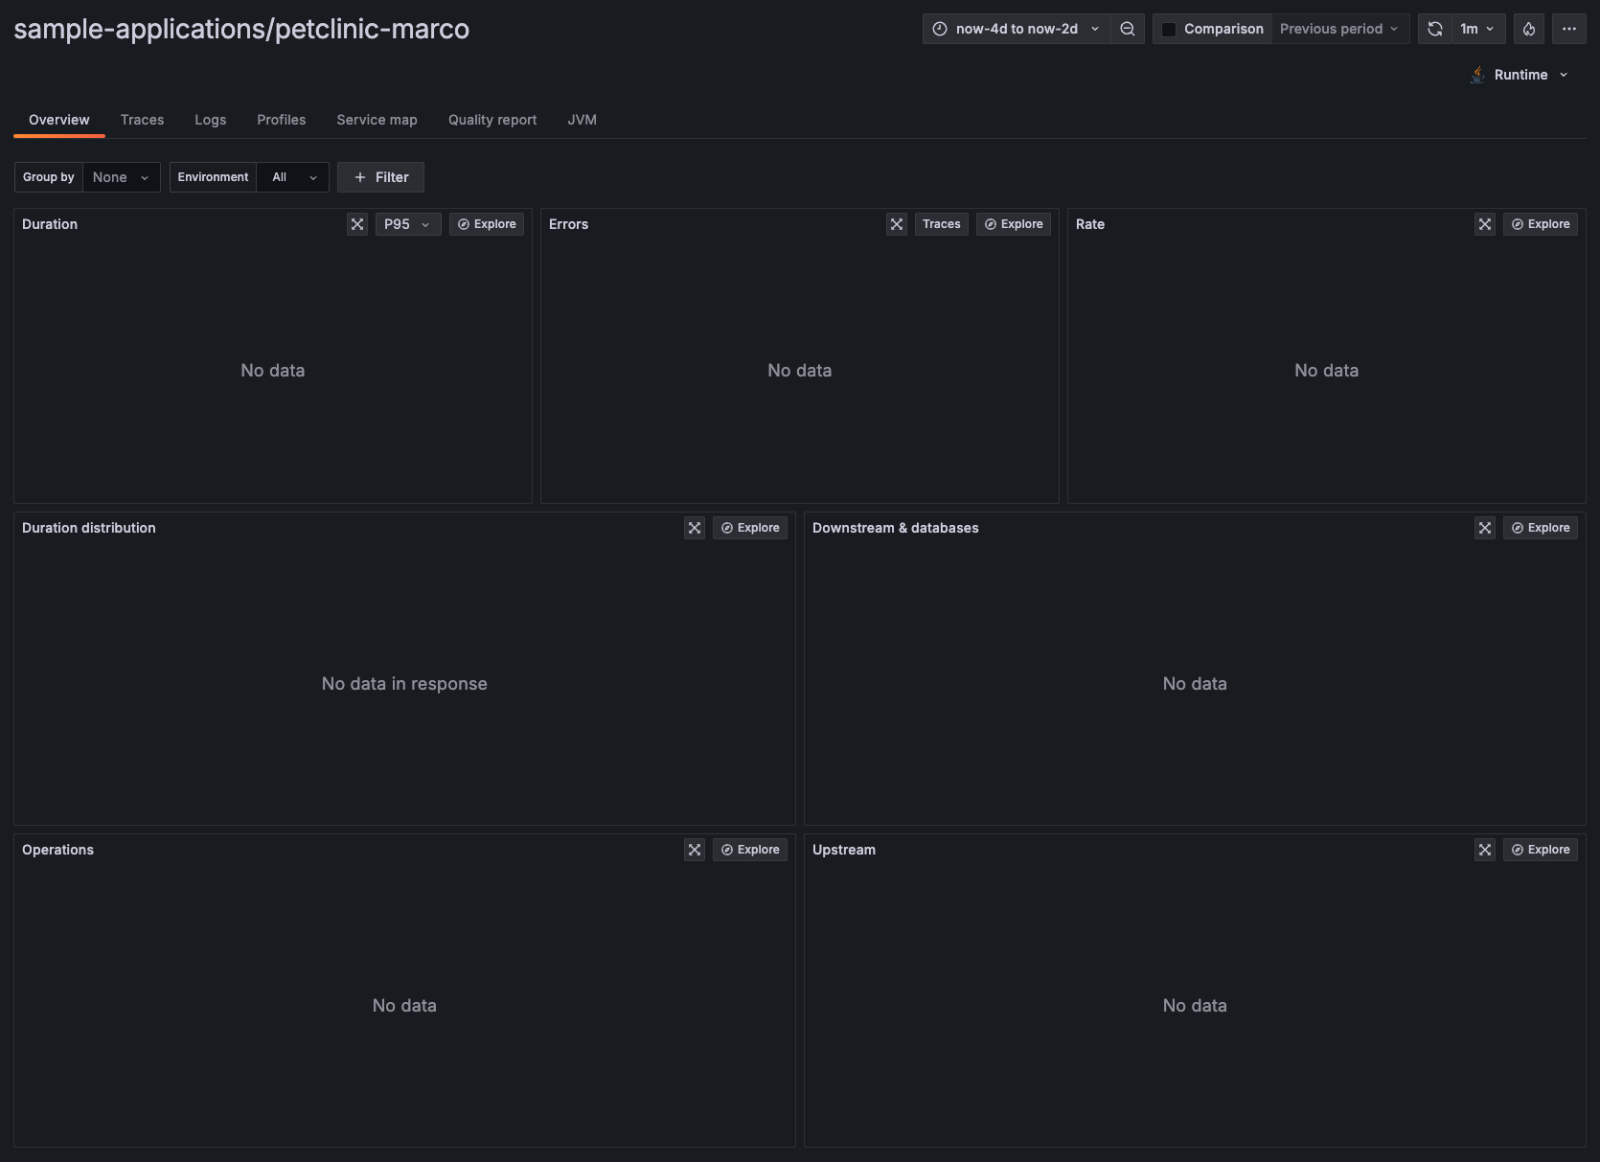
The ability to define a pipeline (actually, more than one) allows us to process the data in multiple ways to add/remove labels, verify compliancy, drop unwanted samples and generate additional data like in this case: we want to generate metrics from spans data, specifically to populate the standard RED graphs on the Grafana UI (user interface). However, there is a chance that, even if you follow all the instructions to set up Alloy, you may end up with empty dashboard panels like in the following picture:

In this case, we need to troubleshoot why this happens.
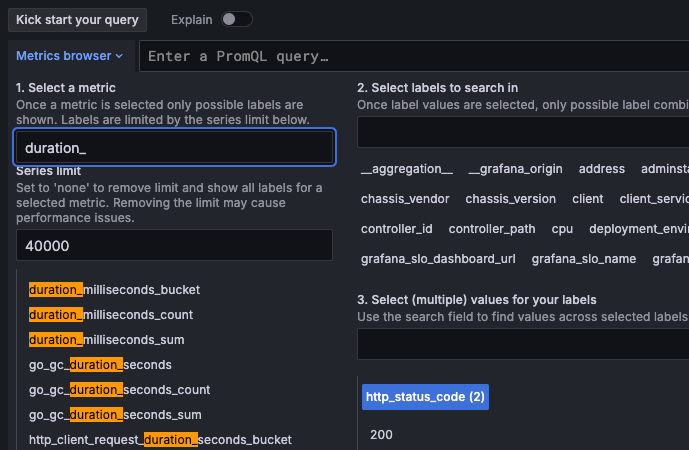
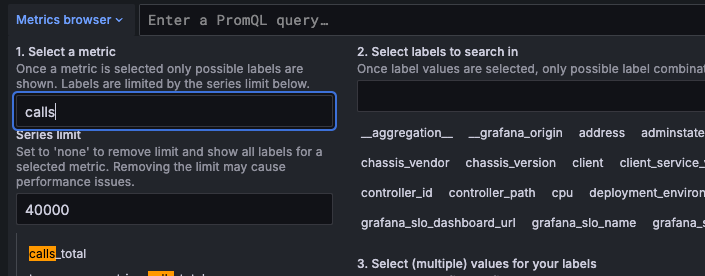
No errors in the Alloy logs and a successful connection to the backend can only exclude authentication and network problems so we’re pretty sure data is reaching the backend. To confirm that, we can use the Explore button to look for the expected metric names.
As you can see, we have duration_* (histogram) and calls_total (counter) metrics for duration and success rate:


So, what’s the issue?
A mismatch between “what I need” and “what’s there”
As mentioned before, those metrics are the output of a specific connector in the Alloy config. The connector takes care of generating the metrics based on raw spans data from your application and then forwards it to the backend where it'll be retrieved by the Grafana UI. So it seems there is some mismatch between “what I need” and “what’s there”.
Luckily for us, the Grafana UI lets us inspect the used query to find out the needed metrics — you just click on the “Explore” button of one of the RED metrics panels. Let’s choose the Duration one (the first on the left).
After clicking Explore we are taken to the Explore page with the query in plain sight:

histogram_quantile(0.95,
  sum(
    rate(duration_seconds_bucket{span_kind=~"SPAN_KIND_SERVER|SPAN_KIND_CONSUMER", job="sample-applications/petclinic-marco", deployment_environment=~".*"} [$__rate_interval])
  ) by (le,job)
)
Query extracted from image for readability purposes
Without getting into details (percentiles are a good metric for call duration), we can see that the required metric is duration_seconds_bucket so that's what the UI needs... and probably doesn't have. In fact, we have a histogram called duration_milliseconds_bucket, which is as cool as it sounds (milliseconds instead of seconds!), but not what we need.
Finding what’s causing this behaviour
So the head-scratching starts: we followed all the examples and best practices over a ton of documentation and yet something is eluding us. Why are we generating a metric for milliseconds when the UI wants seconds?
Let’s get to the real reason for this: the default unit of the histogram generated by the spanmetrics connector is milliseconds (doc reference). So we have to change our Alloy config to force the span metrics connector to generate seconds histograms (as requested by the UI):
[...]
    histogram {
        unit = "s"
        explicit {
        }
    }
[...]
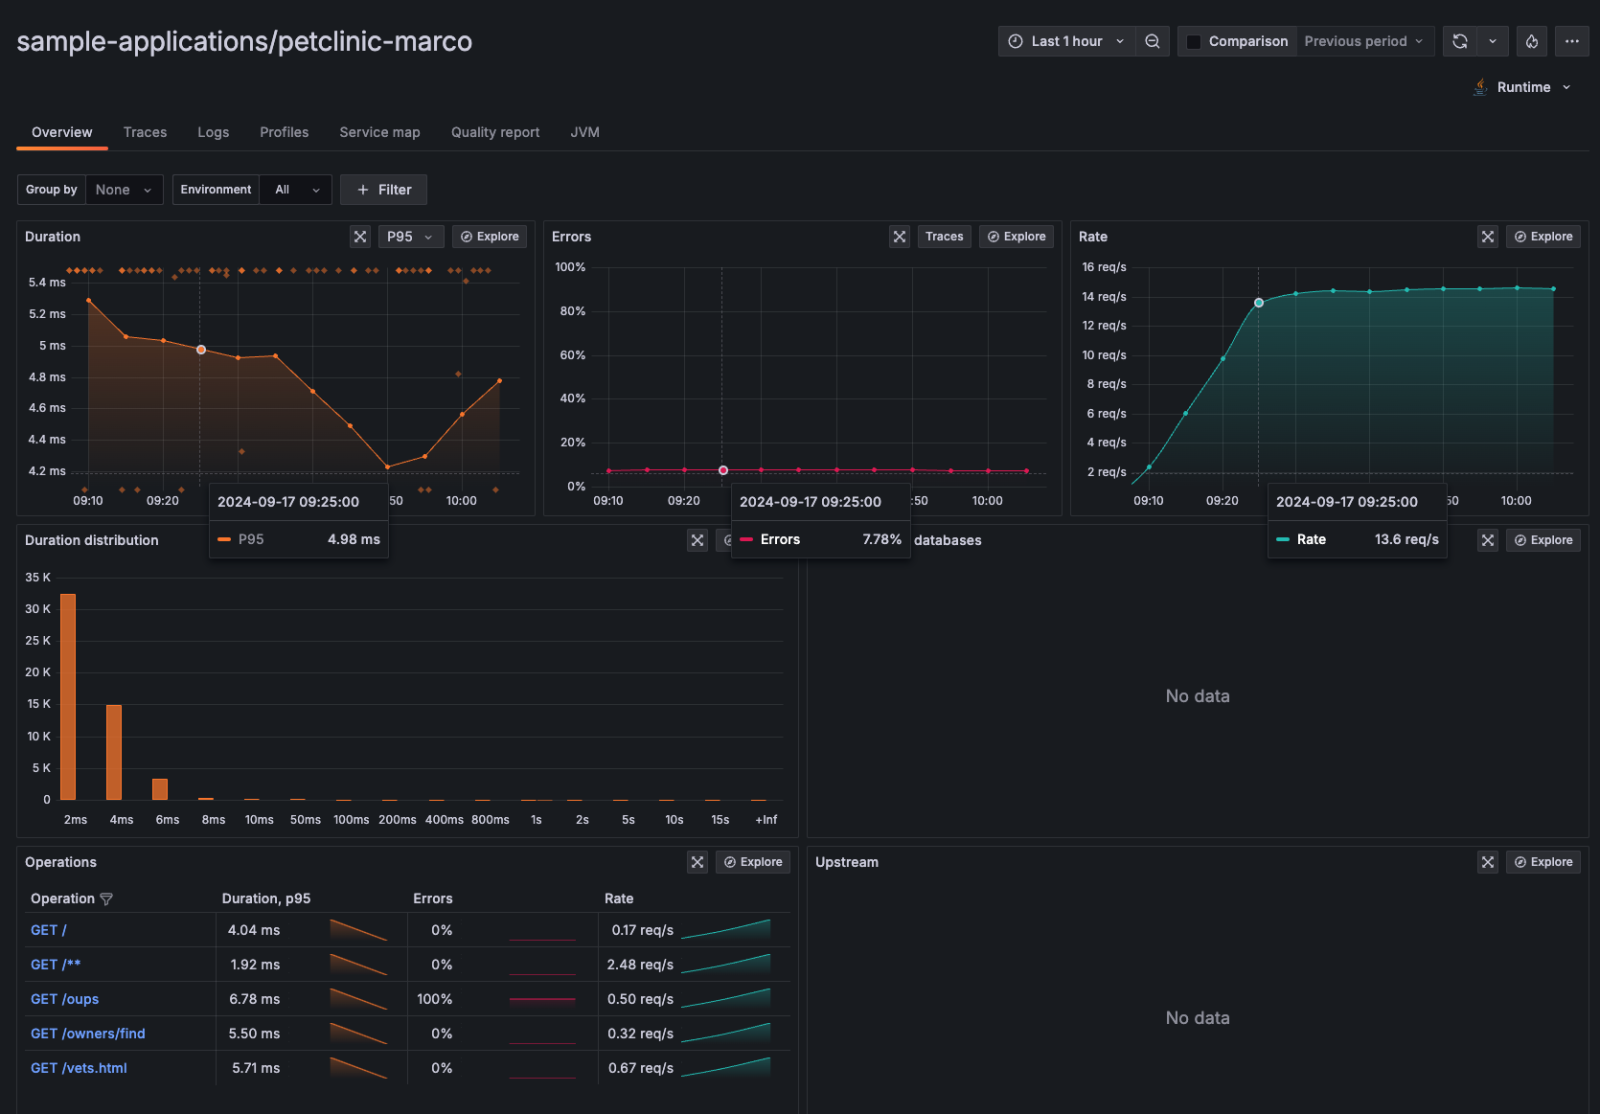
After Alloy reloads its configuration (if you’re running in Kubernetes it’s automatic) we can enjoy these useful panels based on the newly created duration_seconds_bucket histogram:

Conclusion
That shows how tricky defaults can be and, with fast-moving projects, it’s always best to double-check implicit defaults to be sure they match what you need. By following the previous steps you can be sure that you are shipping the correct data and get all the value of your Alloy+Grafana Cloud setup right away.
Want to explore observability further? Check out these three videos we created that each bust a common misconception about observability.
Insight, imagination and expertly engineered solutions to accelerate and sustain progress.
Contact

