Azure real-time insights and visualisations
This is the 3rd article in our Azure series. We have been building an architecture that will work for a simple node application but will also scale to micro-services and/or IoT, and then into a fully fledged solution platform running on Azure. In the previous two articles, we focused on rapid application development on Microsoft Azure , and how to collect fast Pino logs in an Azure Event Hub . To complete the first part of our series, we will investigate how we can process and gain insights from the data we are generating.
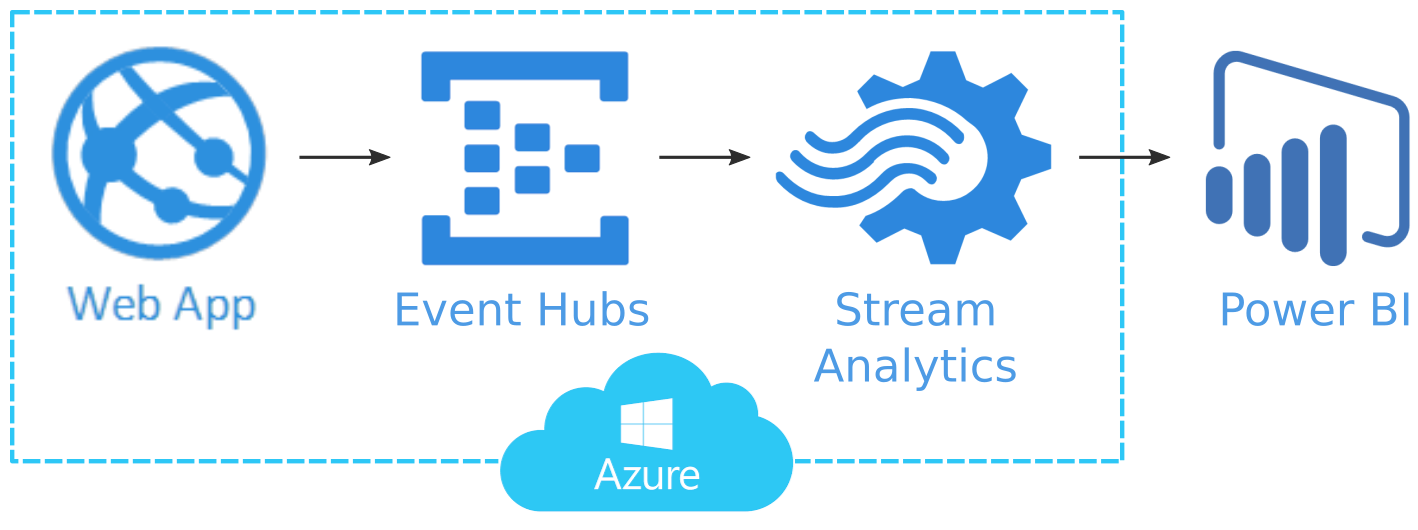
Real-time insights: Stream Analytics
This post assumes you have a Web App that pipes logs into an Event Hub. (If not instructions are included in the previous article .) Now we want to be able to gain real-time insights from that data.
Azures Stream Analytics processes data in real-time. In Microsoft's words:
“Using Stream Analytics, you can examine high volumes of data flowing from devices or processes, extract information from the data stream, and look for patterns, trends, and relationships. Based on what’s in the data, you can then perform application tasks. For example, you might raise alerts, kick off automation workflows, feed information to a reporting tool such as Power BI, or store data for later investigation.”
With Stream Analytics we want to be able to extract information from our log stream, eg,
- Query response times
- 90th, 95th and 99th percentile response times
- Warnings on a 404 requests
- Alerts on Denial-of-Service attacks
For this article, we will simply look at query response times.
Real-time dashboard: Power BI
The last piece of our minimal architecture would be to visualise the information extracted from our logs. Azures Power BI Embedded allows the creation of a real-time dashboard by embedding components in your application. However, for the simplicity of the article, we will be using Power BI where a dashboard is ready for use.
Caveat Emptor: Even though the Power BI dashboard uses real-time data, it has to be manually refreshed to show it.
Initial setup
To start, please provide a basic application with logging, as per Collect fast Pino logs in an Azure Event Hub .
Provision Power BI
First, we want to set up our Power BI account, because Stream Analytics would need it as a target output.
Power Bi UI is not completely integrated into Azure UI yet. Do not set up your Power BI account from within Azure. Instead, open https://powerbi.microsoft.com/en-us/get-started/ Click Try Free (in the middle-left of the page) under Power BI Cloud collaboration and sharing, then register with your existing Microsoft login.
Now we want to create a workspace from the menu on the left:
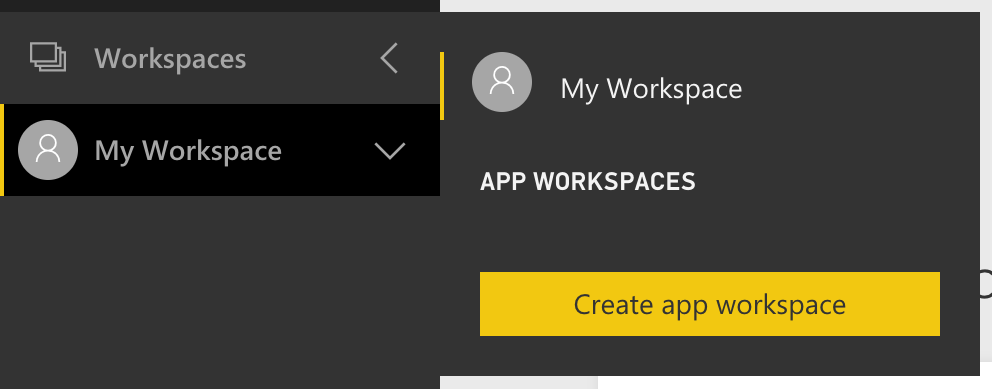

Now we can proceed to create a workspace named pinoPowerBI :
[
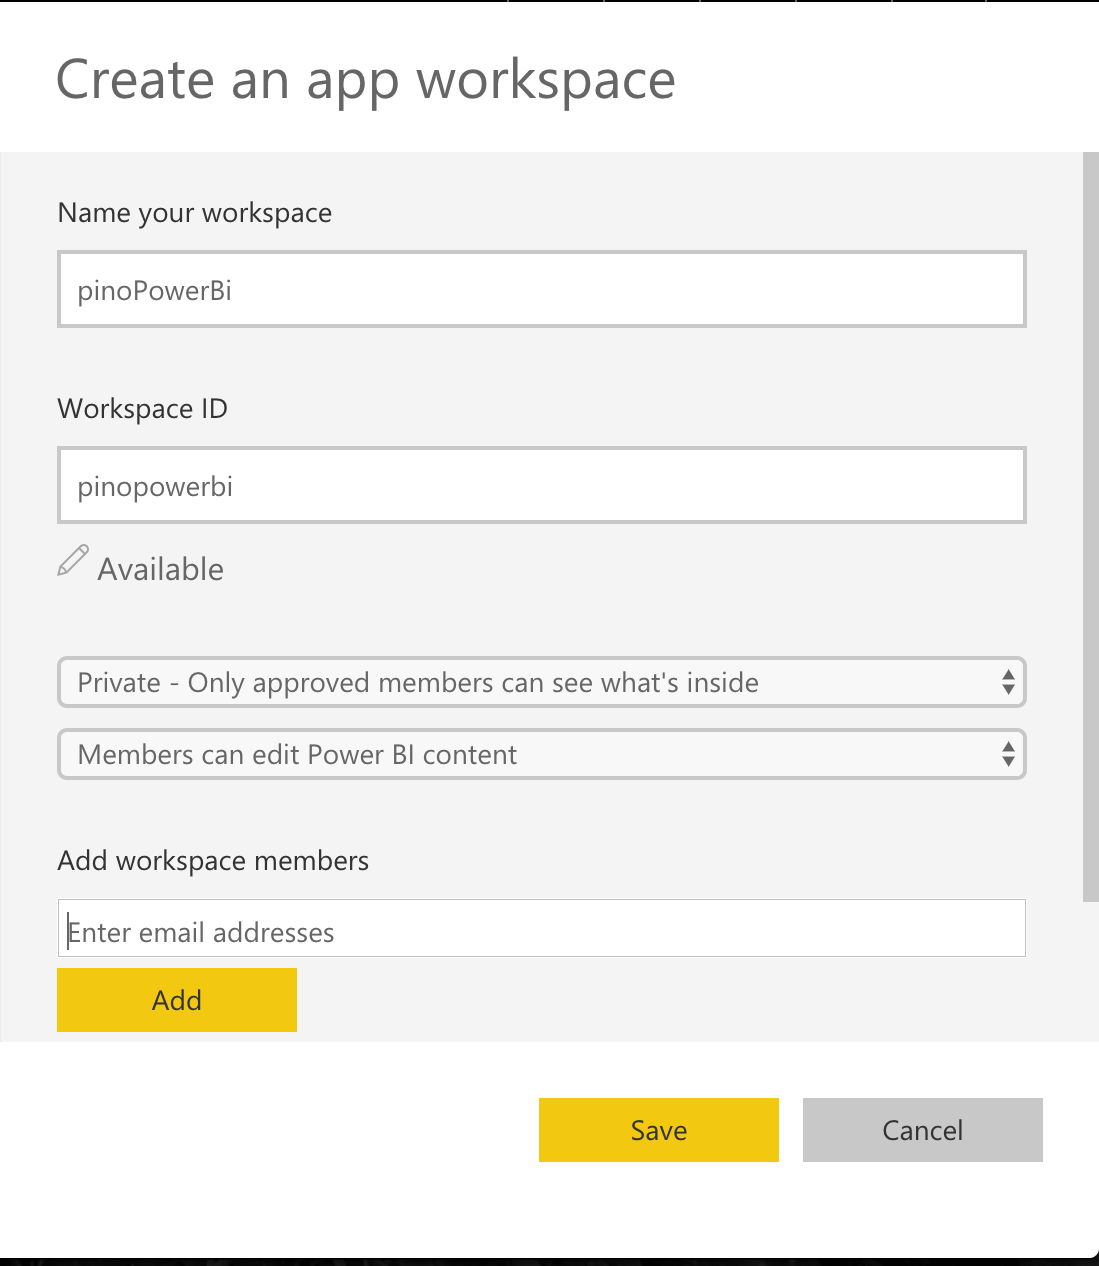
][1]
Register your app on Azure Active Directory
Some of the online advice says that it is a requirement to register your app on Azure Active Directory (AAD). However, this only relevant if you want to embed Power BI into your app. We will be viewing our graphs directly on https://powerbi.microsoft.com/ , so we can ignore this.
Provision Stream Analytics
Create an input and an output
Microsoft uses the words input and source, and output and sink interchangeably. In this article, we will stick to input and output.
Go back to https://portal.azure.com/ . Search for Stream Analytics jobs :
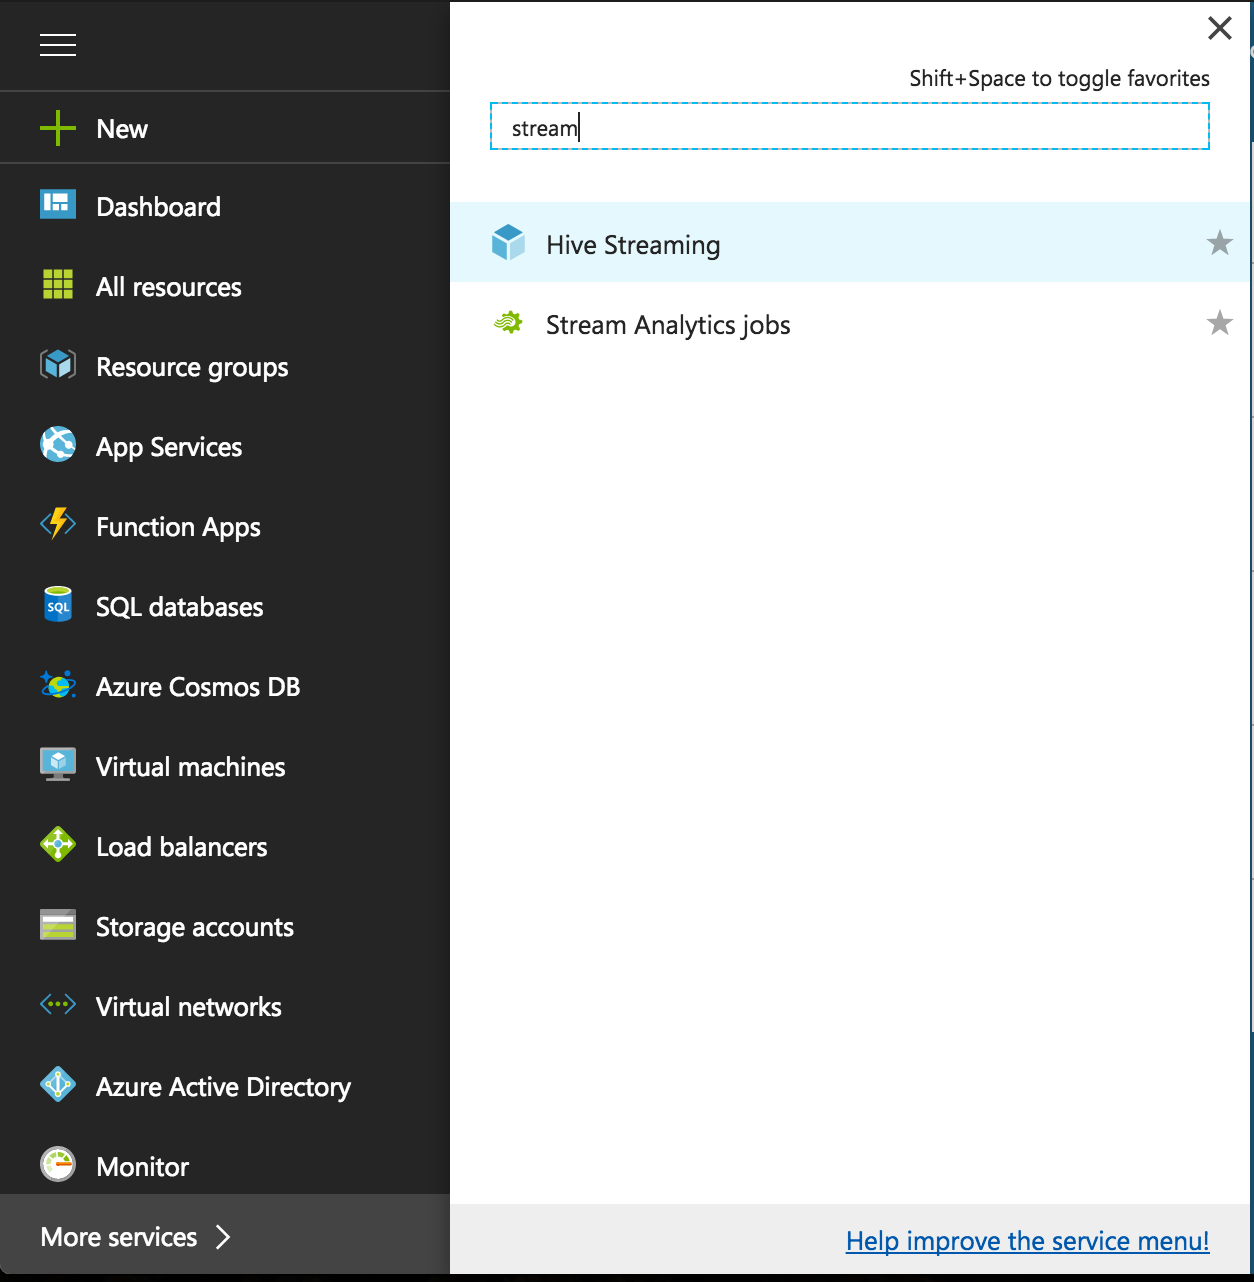
Add a New Stream Analytics Job , named responseTimesAll :
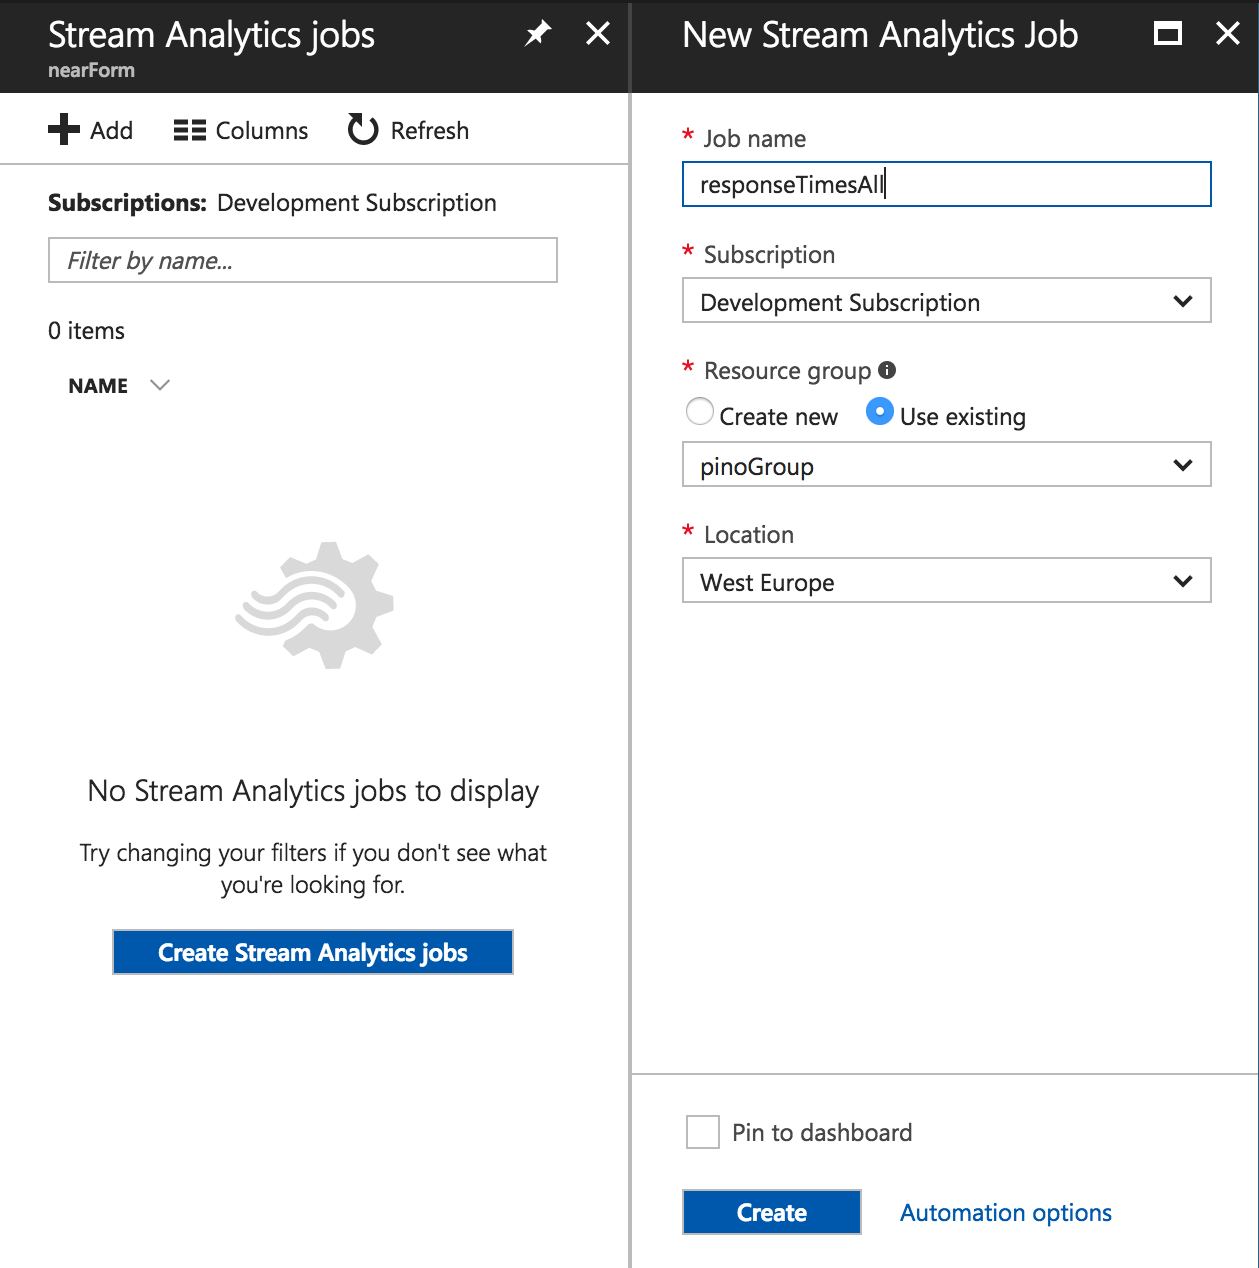
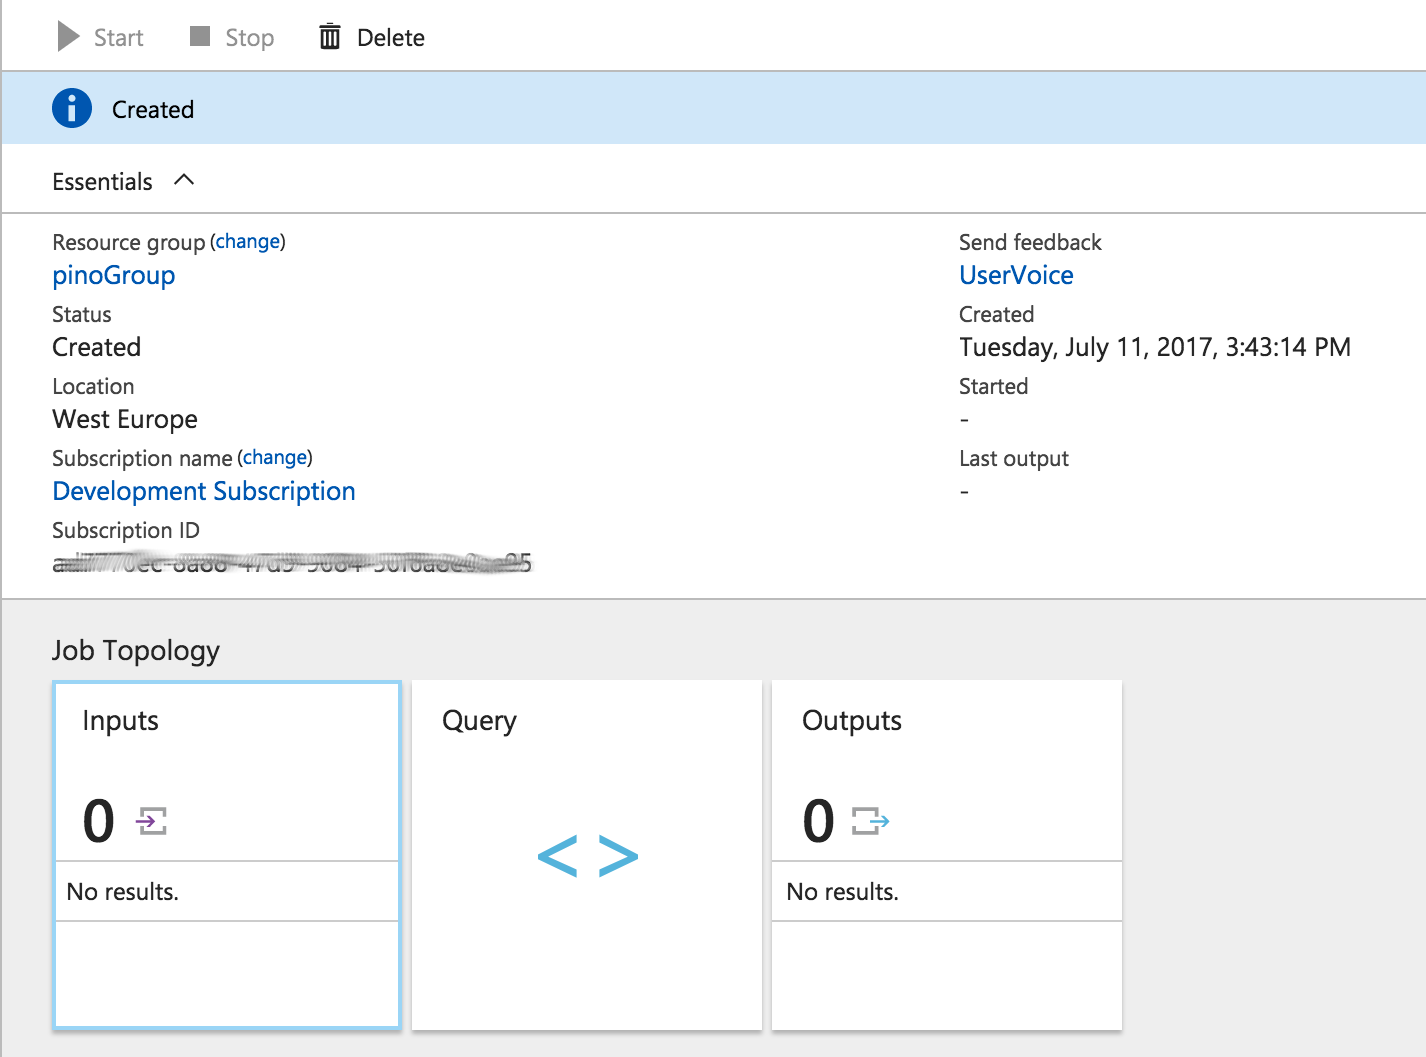
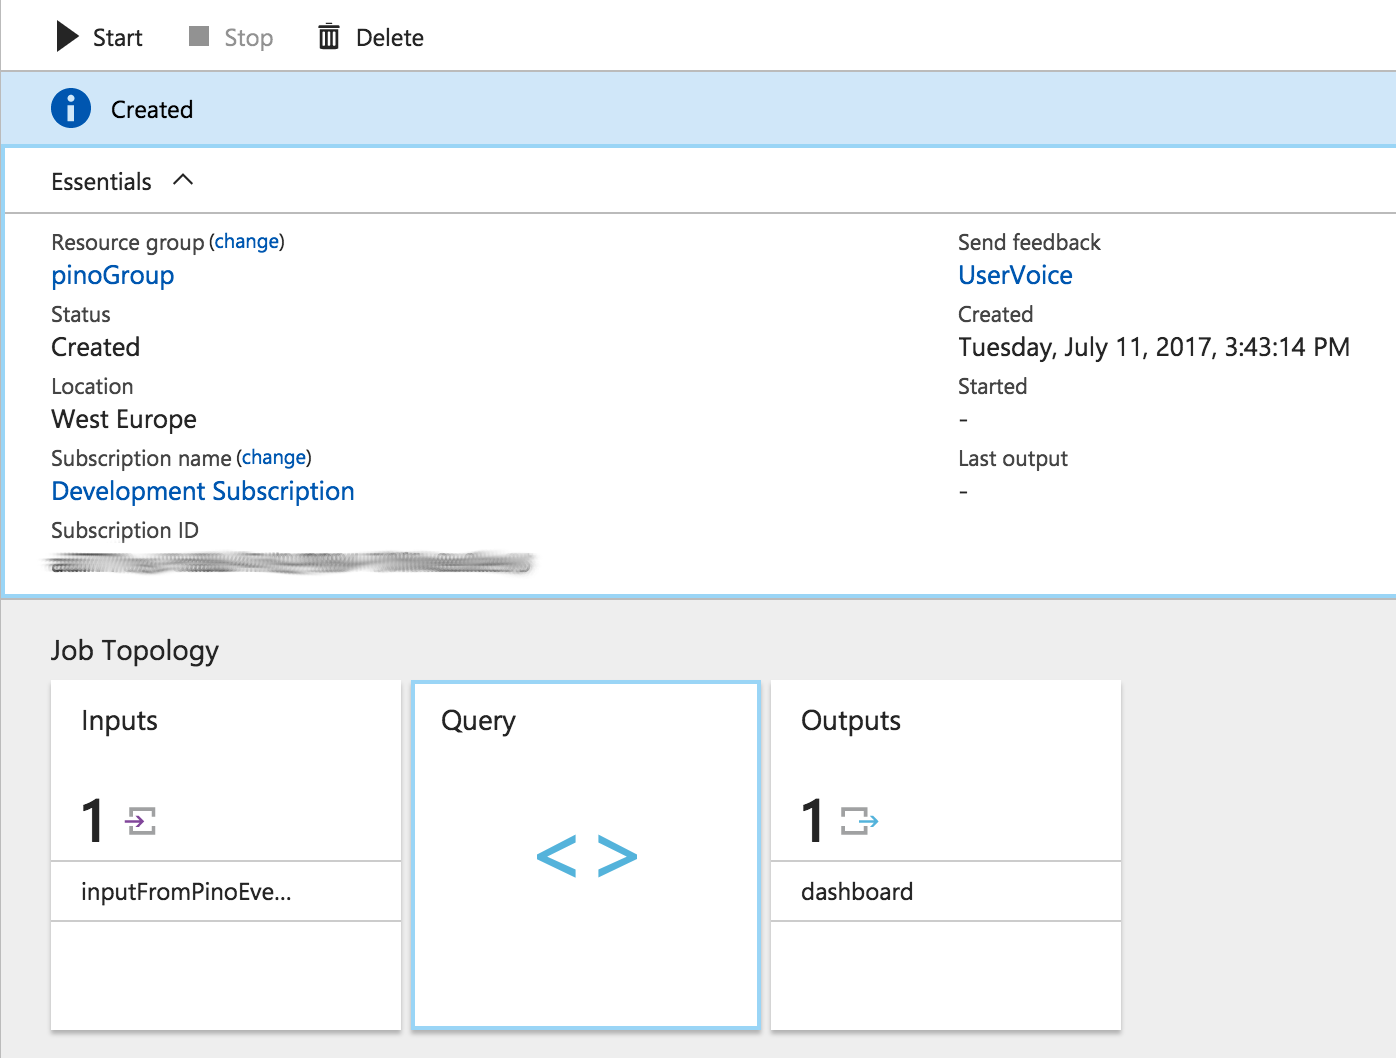
This should result in a success screen like this:
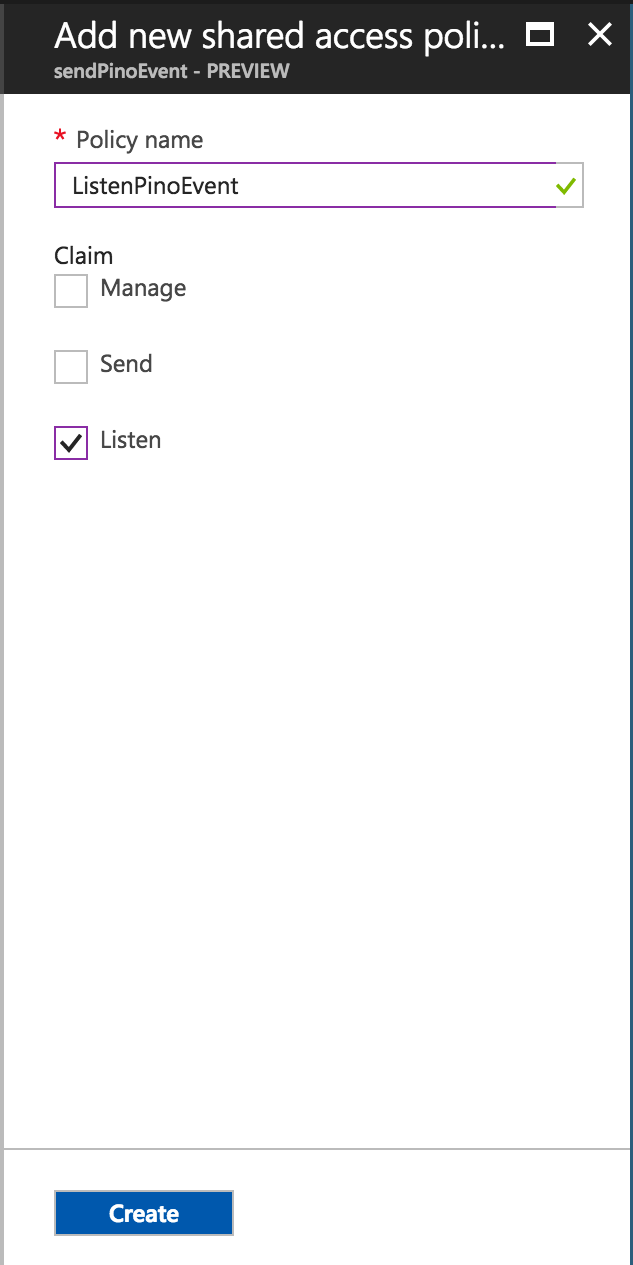
Before we create the input. Go create an Event Hub policy under pinoEventHub called listenPinoEvents with listen privileges:
Now, click on Inputs under Job Topology :
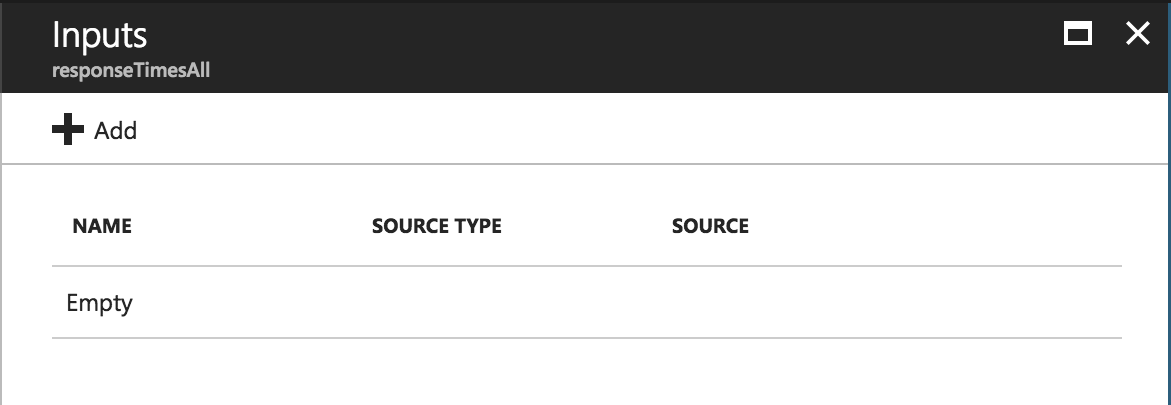
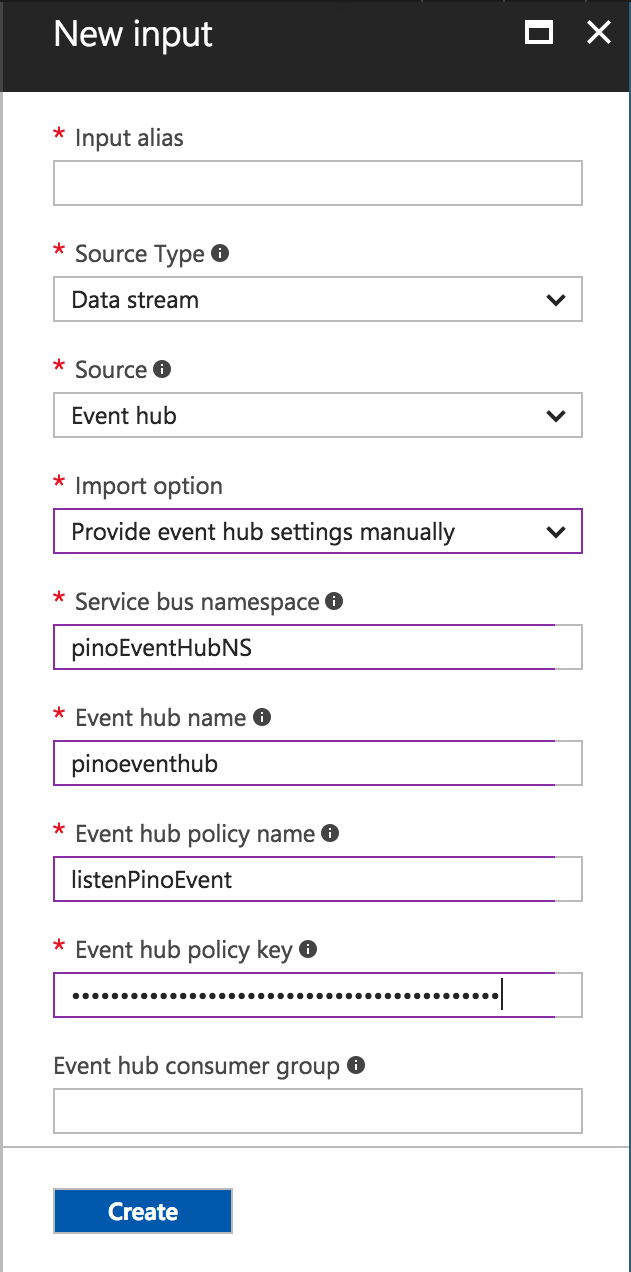
Add a new Input and connect it to listenPinoEvents with alias inputFromPinoEventHub :
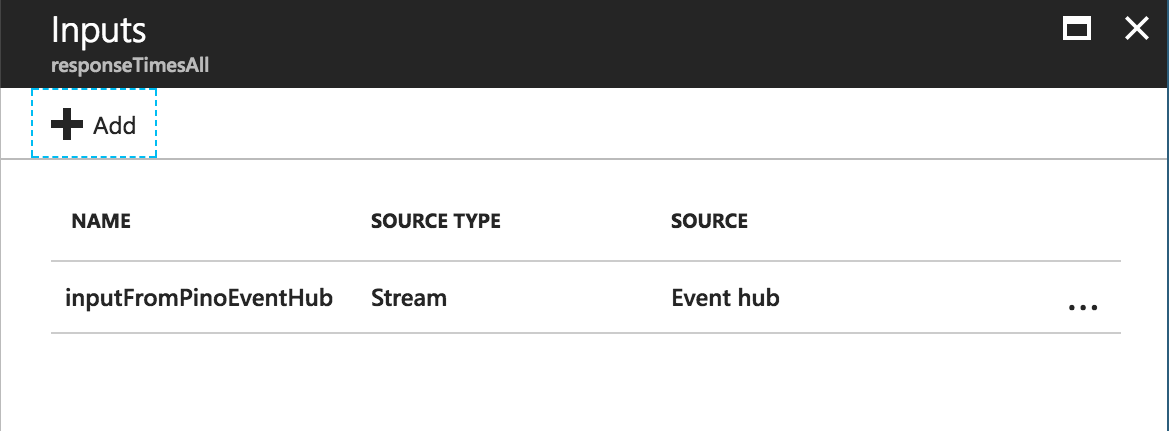
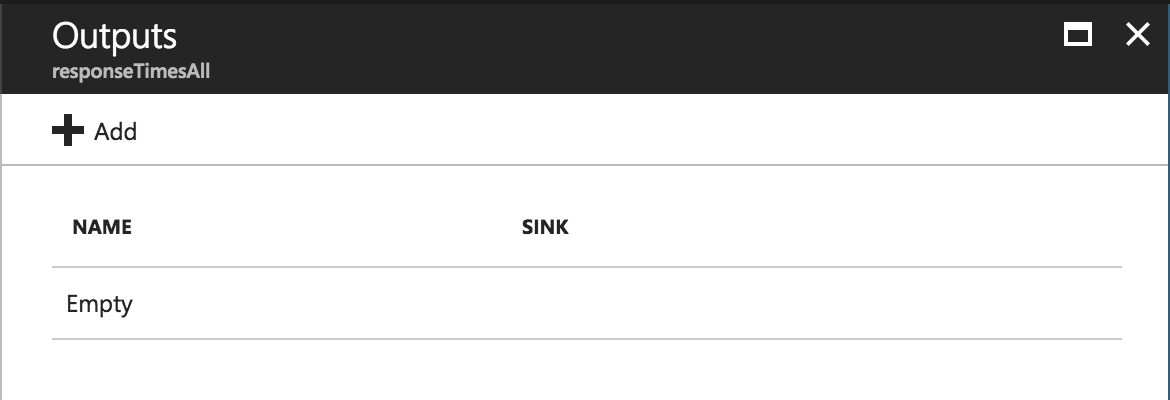
Click on Outputs under Job Topology , and choose to add a new Output :
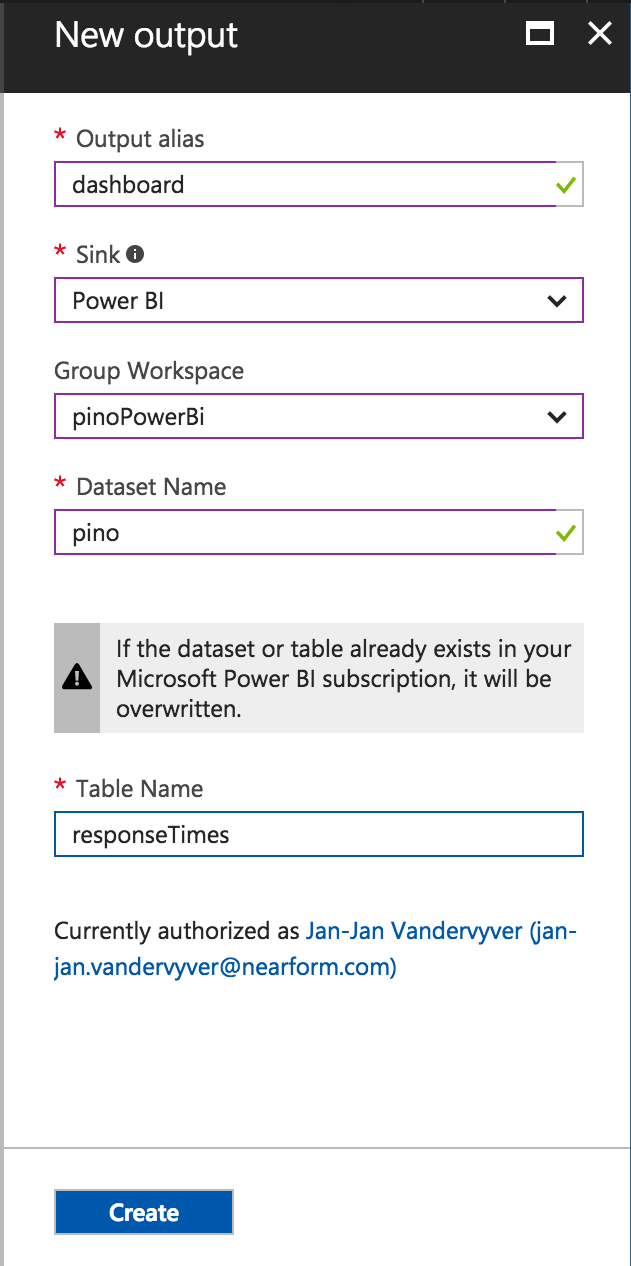
Name the output alias dashboard , and choose Power BI under Sink :
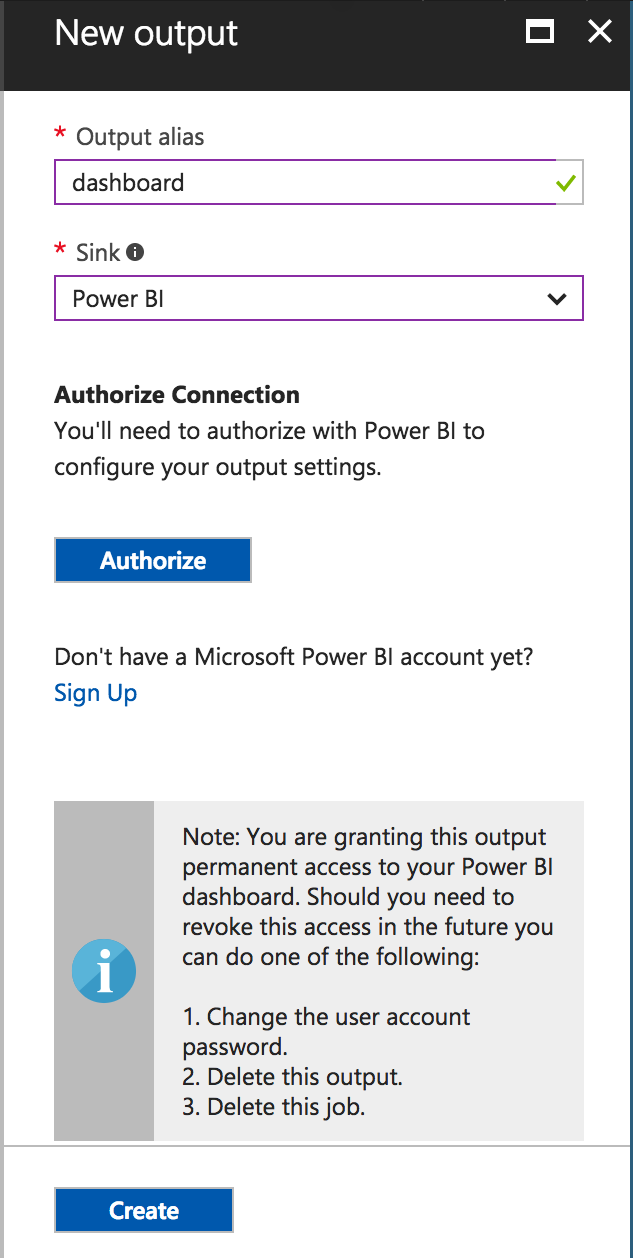
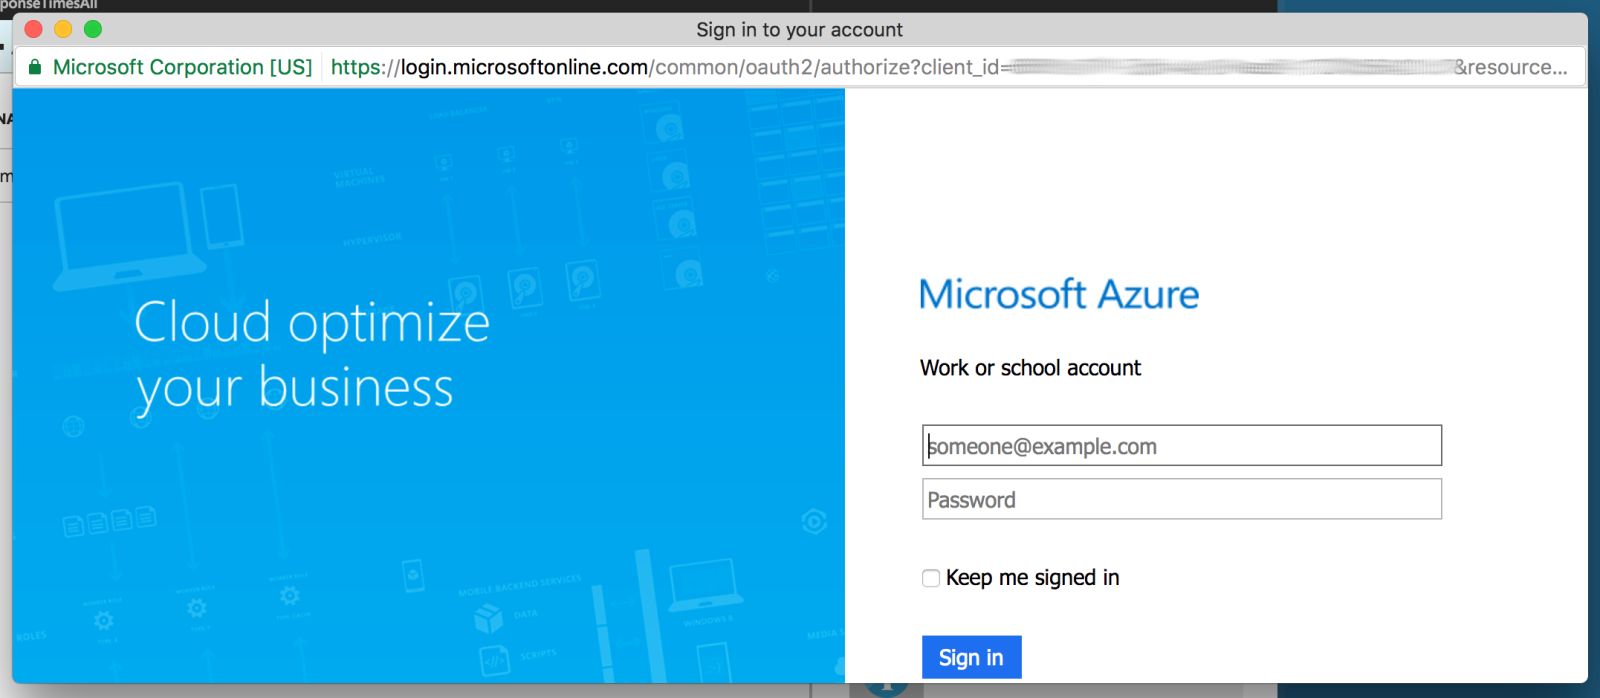
Now click authorize, and sign in with the Power BI user you enabled earlier:
Now we can create the Output named dashboard , in Group Workspace pinoPowerBI , with Dataset Name pino and Table Name `responseTimes :`

Now we are all set to connect input and output.
Real-time query language
The real power of Stream Analytics is the Stream Analytics Query Language . We will only be doing a simple example, but with this language queries can done as data is received from the input.
To create our query we will select Query under Job Topology :
We want to create a time-series graph showing response times of queries against time. So, we need to SELECT responseTime and time . We take those values from the input inputFromPinoEventHub and send them into the output dashboard , using FROM inputFromPinoEventHub and INTO dashboard .
However, Pino formats time in unix time, and Power BI needs it in ISO 8601 format. In Stream Analytics every event has an associated time stamp. We can override that time stamp and convert our time value into ISO 8601 format, using TIMESTAMP BY DATEADD(millisecond, time, 1970-01-01T00:00:00Z) . Lastly we need to change our SELECT to pick the event time stamp we have overwritten System.Timestamp AS time .
Lastly, we want to filter for log results that actually have a responseTime defined, which WHERE (responseTime > 0) will do for us.
Resulting in this query:

Before we save this as done, we can test the query by uploading test data:

If you run the test, you should get some positive results:
We can now save our query, and then start the Stream Analytics job (this might take a couple of moments). Once, the running sign is up, refresh your Web App url. Then you should see an event:
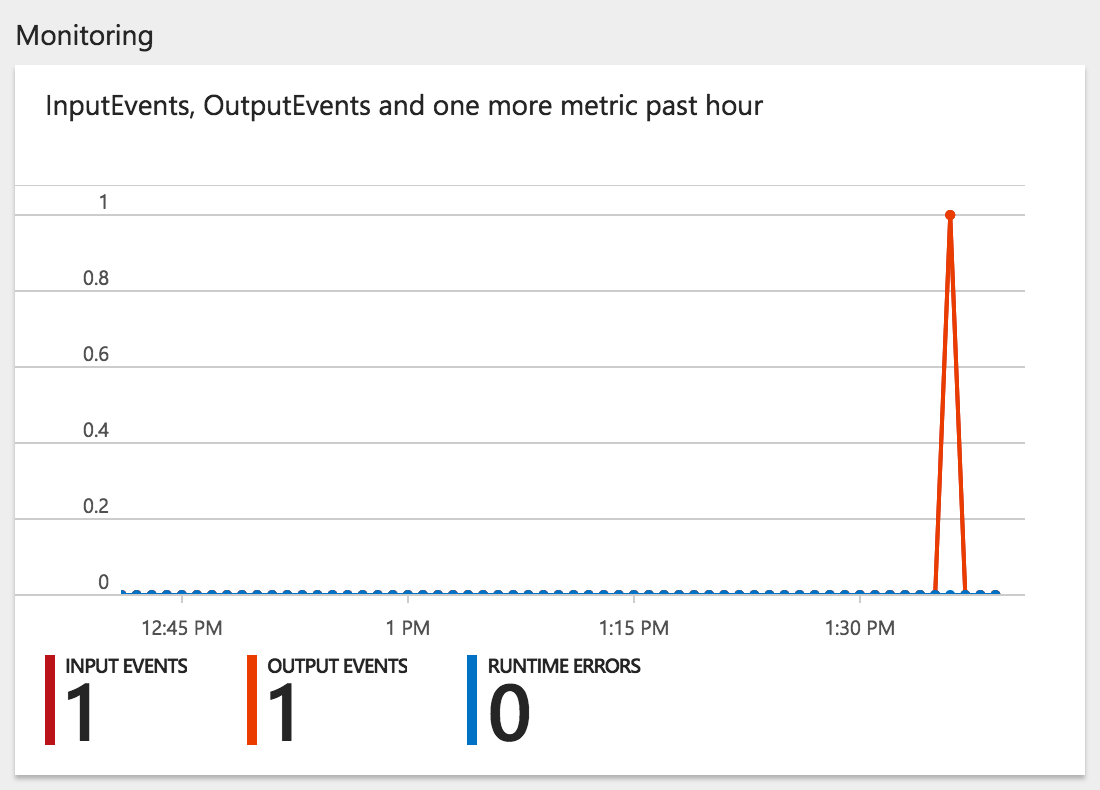
That single event we witnessed before created a pino dataset in Power BI. Go ahead and create a couple more data points by refreshing your web page.
Visualize the data
Now, we leave https://portal.azure.com/ and return to https://powerbi.microsoft.com/ . Expand tour pinoPowerBi workspace. If it is not visible, select it under Workspaces :
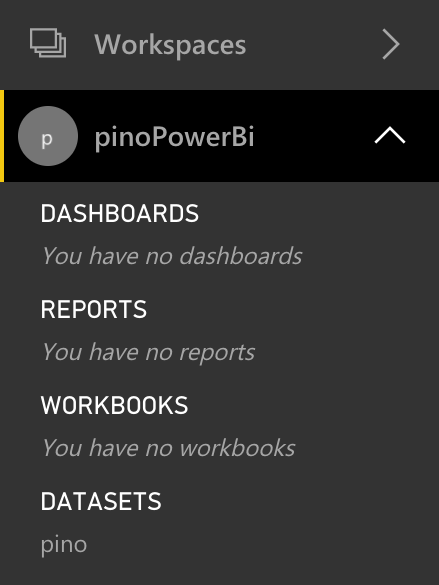
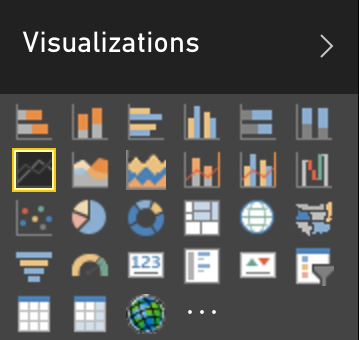
Now, under DATASETS , click on the pino , and select a line graph.
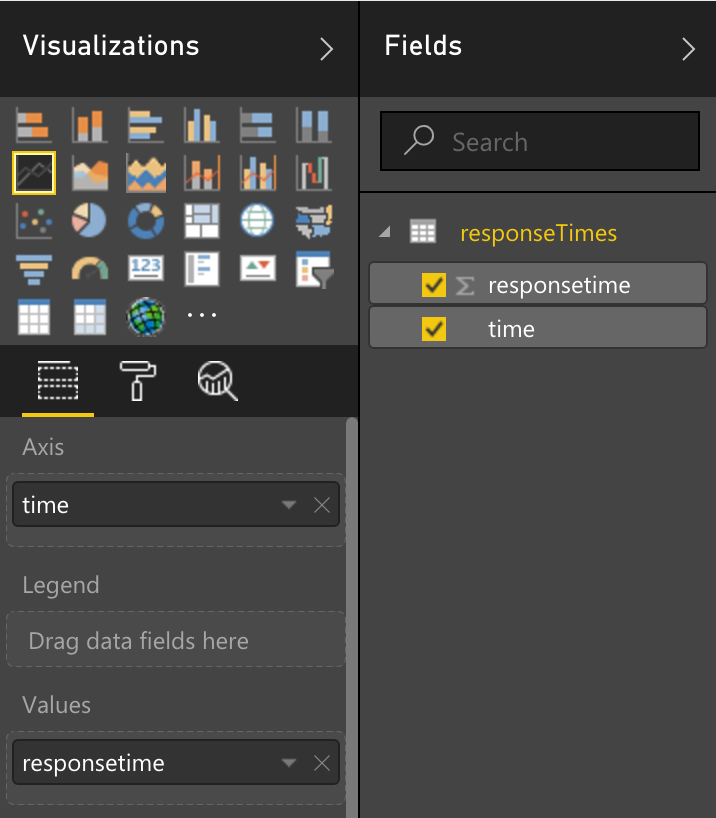
To populate our graph, we drag time under Axis . And, we drag responsetimes under Values :
To view our graph simply maximise it:
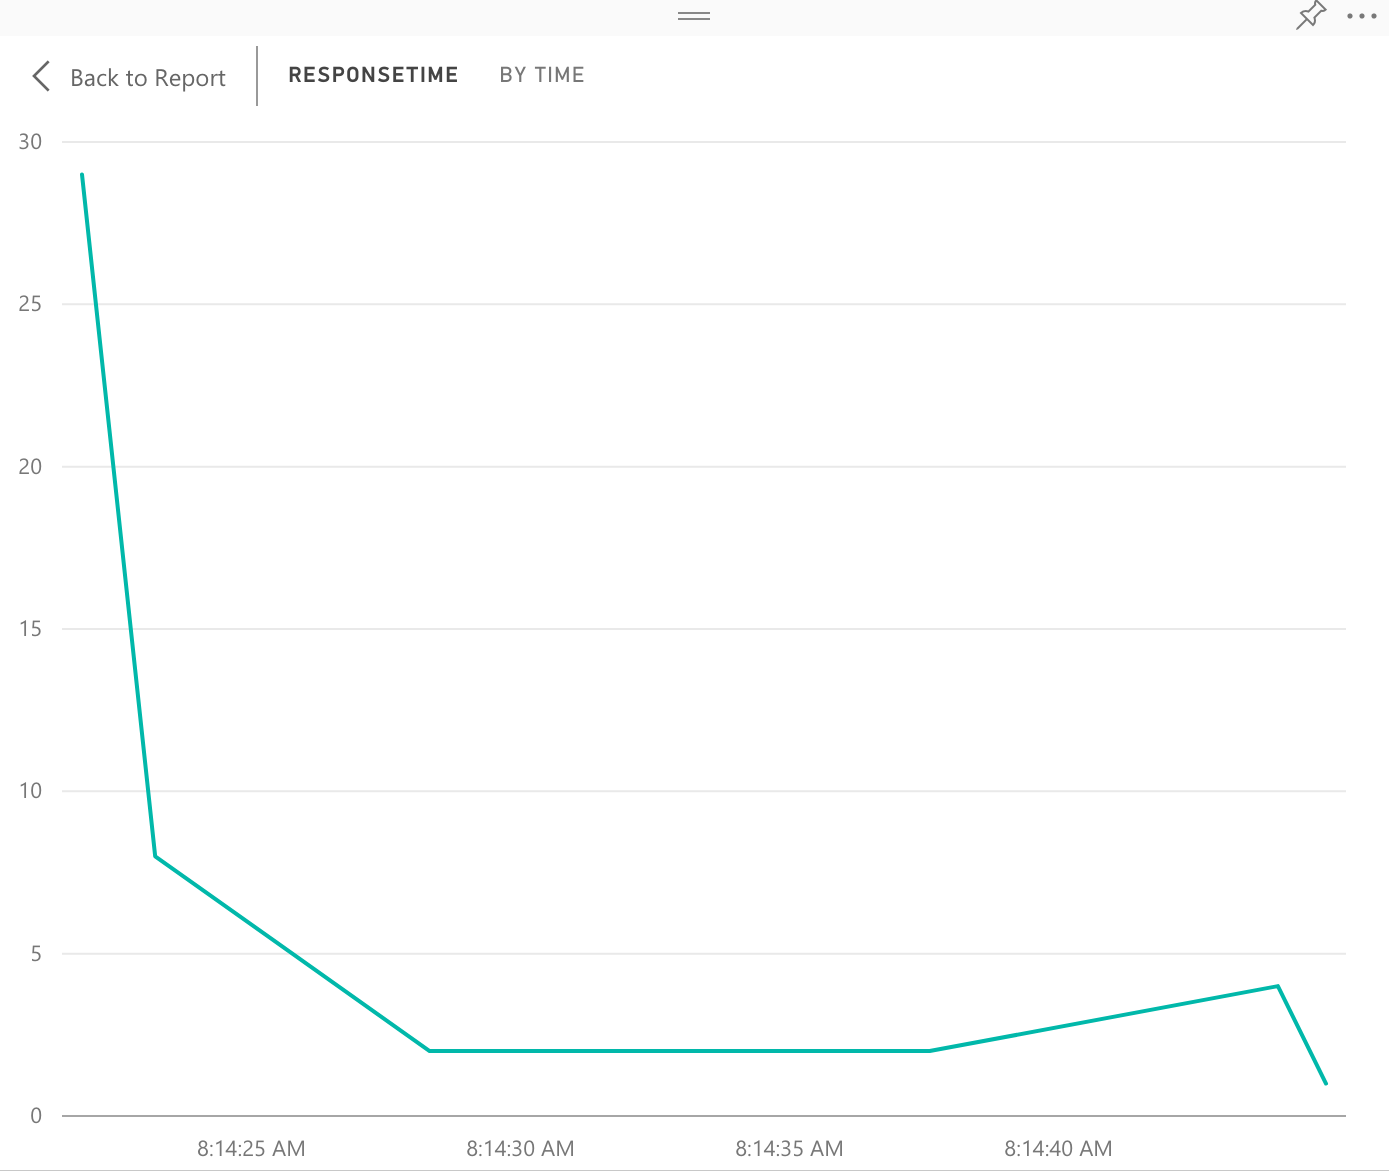
To keep this graph save it to a report.
Caveat Emptor: Time Zones
Pay attention to time zone being displayed. I've noticed 3 time-zones being used in graphs across Azure and Power BI: The time-zone I'm in, the time-zone my company is in, and GMT +0.
Azure Resource Manager templates
We provisioned Event Hubs and Stream Analytics using the Azure Portal point-and-click interface because we wanted a first-time or prototyping user to be up-and-running with Azure as quickly as possible. As your product or usage matures though, you would want to describe your infrastructure in code. This is what Azure Resource Manager templates are for. These templates can be harnessed from the Azure CLI , to deploy, update, or delete your resources in a single action.
Conclusion
Power BI and Azure might not be fully integrated on a UI level yet, but the back end integration works great. Stream Analytics real-time insights combined with Power BIs embedded visualization functionality allows opportunities to present business value metrics to management in custom apps.
Here ends our series on setting up a basic Node.js app using Azure. Next, we will look at using Docker to provision a Node.js app on Azure Web Apps.
[1]: /wp-content/uploads/jekyllsite/blog/2017/07/02b-create-workspace.png Scott Rodgerson
Insight, imagination and expertly engineered solutions to accelerate and sustain progress.
Contact