Hapi: A Performance deep-dive
Improving hapi performance in real-world use cases
Recently we were tasked with investigating performance with the popular web framework hapi. Performance means a lot of different things, but we wanted to see if we could improve the requests per seconds that hapi could perform on real-world use cases. Real-world means not just “juicing” the stats to improve various benchmark scores but actually trying to figure out what kind of bottlenecks appeared when using the framework for the application you’d normally do when writing an application deployed for a wider audience.

If you do not know hapi , it is a popular web framework for Node.js frequently popping up in “Best Frameworks” lists across the web. It is always a fun challenge for us to try to improve code used by thousands of users around the world so we were excited about squeezing more performance out of it.
We do this kind of performance work quite a bit both in our personal open source modules and also for clients. The method usually goes something like this:
- Get a simple benchmark going with the less external factors the better. Run these against Clinic.js to see which recommendations it comes up with.
- Sprint through the code base, looking for patterns and pitfalls we often see slowing down performance.
- Get as many easy wins as we can, verify against the benchmark.
- Go wider and try to mimic production setups with a bit more advanced benchmarks.
- Using the tools recommended by Clinic.js and Chrome dev-tools measure and try to identify and fix bottlenecks.
More often than not, it’s the same patterns and architectural choices that lower CPU-bound performance in modules so when you’ve fixed a bunch of these in other modules it helps you identify them in subsequent projects as well.
When we were looking at performance at things such as web frameworks we are lucky to have a lot of similar libraries out there in the same space. This makes it easier for us to identify bottlenecks by comparing scores between modules. For example, when serving a simple GET request if other web frameworks such as Fastify or Express are faster than hapi, it is usually a strong signal that there is a bottleneck waiting to be fixed.
Disclaimer
It is worth mentioning that tuning your Node.js code for performance can have pretty serious drawbacks to readability and maintainability of your codebase. It’s often not worth doing this except for “hotpaths” in your code, i.e. code that is run *a lot* and where it represents a bottleneck. Even then if you performance-tune and end up with a 1-5% improvement it is usually better to keep a simpler implementation versus a complex slightly faster one. Tuning your code also puts a higher maintenance burden on you, as performance can change based on V8 versions, I/O performance etc.
Setting up benchmarks
With all of this in mind, let’s continue. For simple benchmarks, we’re in luck as plenty exists for web frameworks in Node.js already. These benchmarks are usually a bit synthetic since they often test how fast each framework can return a simple static JSON object in a GET request. Obviously a web application does many more things than this but it still gives us an idea on how fast the core of the framework is and gives us an idea on the performance impact of our improvements.
The benchmark we used was the one maintained by the Fastify community. This suite is quite nice as it both provides a simple tool to compare popular frameworks against each other as well as having bare “hello world” implementations for each individual framework. We can get a simple request per second score out of this by spinning it up locally and using autocannon , a http benchmarking tool.
$ npm install -g autocannon
$ git clone git://github.com/fastify/benchmarks
$ cd benchmarks
$ autocannon --on-port '/' -- node benchmarks/hapi.js
The last command above will spin up the benchmark hapi server and when it is listening on a port, autocannon will bombard with http requests against the path ‘/’ for 10 seconds. When it is done we’ll get a score out that looks similar to this:

- Req/Bytes counts sampled once per second.
- 103k requests in 11.05s, 16.9 MB read
We can use this score as a baseline to track our improvements.
Initial improvements
As mentioned we like to approach performance improvements as iteratively as possible. It’s easier to see the impact of changes if we test as often as possible - if we test too many things it’s hard to know what worked vs what didn’t.
For a first pass performance review of a codebase we look for patterns we know from experience can cause problems that have easy fixes. Some examples of this are:
- Dynamically setting properties on class instances, which can change the hidden class V8 uses to optimise.
- Calling methods that result in native calls underneath the hood in Node.js. Going from JS to native and back can have a substantial overhead in hot code.
- Doing too much static work in each function call. For example, a pattern we see a lot is plugin systems doing setup work on each request instead of once when a plugin is added.
- Using too many runtime closures in a hot function call.
- Making big dynamic objects instead of class instances.
This is a good time to remember the disclaimer above as many of these patterns we look for changes based on V8 and Node.js versions. Always remember to test each improvement in a benchmark and ask yourself if optimisation is really needed.
We also look for overuse of promises as they have been a recurring theme for us in past reviews, but more on that later.
Applying these patterns to the hapi codebase we found some interesting things. Since we’re only interested in optimising hot paths we focused our attention on the request-response lifecycle code. Here we found some easy wins, that is probably surprising if you’re not deeply familiar with Node.js core’s codebase.
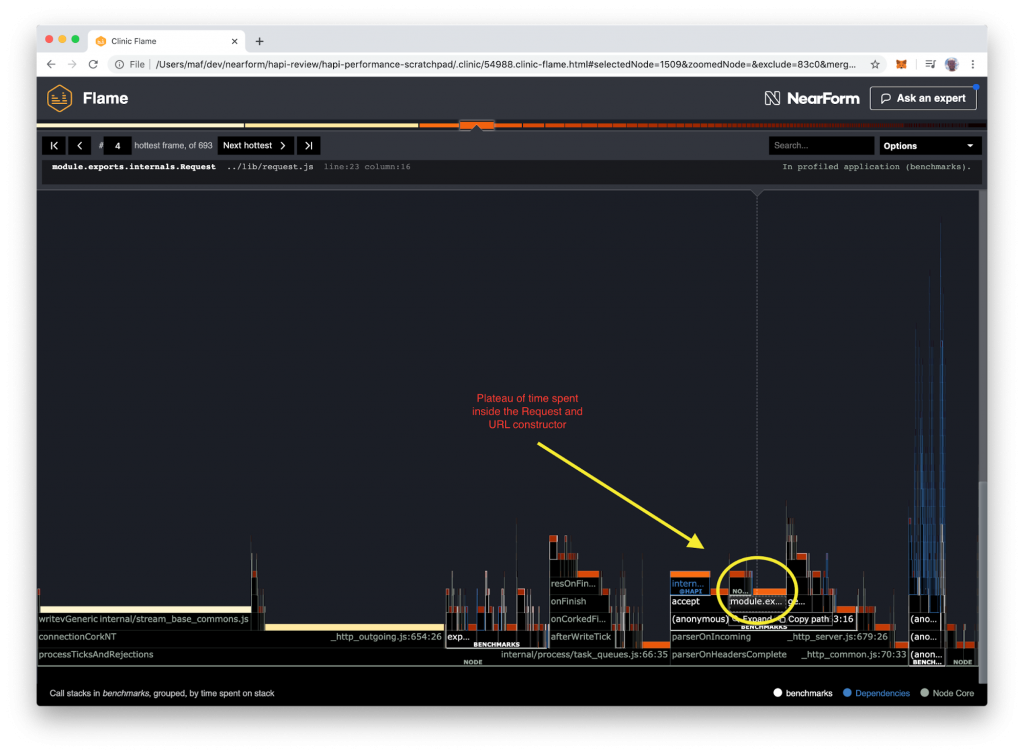
On every request, hapi would parse the HTTP request path into a URL object using the new url api in Node.js . Normally this shouldn’t be a problem but given our background as Node.js collaborators, we knew that the URL object currently is backed by native code. This means that expensive JS to native roundtrip on every request. Since a lot of real-world use-cases do not need to access all the subcomponents of the url object we added lazy parsing of the url to avoid the roundtrip . In the same theme hapi also accessed the remote port and remote IP address of each HTTP connection to expose them to the user, using req.connection.remotePort and req.connection.remoteAddress. Both of these are actually getters that also result in a native roundtrip. Again since a lot of use-cases didn’t require these we wrapped these properties in another getter.

Additionally, hapi constructed a decently sized stats object on each request as a dynamic object. To help V8 construct this object faster we moved this into a class with no methods instead .
// Using a getter to access an expensive property as remoteAddress is actually a getter to native code
get remoteAddress() {
  if (!this._remoteAddress) {
    this._remoteAddress = this._connection.remoteAddress
  }
  return this._remoteAddress
}
Using these methodless classes has an added benefit of being able to easily spot these objects when you do a heap snapshot as they are grouped by class name.
To test these assumptions we did another benchmark run using autocannon with the improvements enabled:

- Req/Bytes counts sampled once per second.
- 122k requests in 11.06s, 20 MB read
As we can see the impact was quite significant with little complexity added to the codebase, all in all, a decent trade-off so far.
Code Generation
The second phase of our analysis was aimed towards finding places in the source code where dynamic code was being used. By dynamic code here we mean the pattern used by a log of HTTP frameworks where plugins etc, extend the capabilities of the APIs provided.
A pattern often used with plugin APIs is adding a series of functions to an object in a constructor similar to this:
class Thing {
  constructor (plugins) {
    for (const { name, fn } of plugins) {
      this[name] = fn
    }
  }
}
Since JavaScript is a pretty flexible language these patterns can be improved quite a bit with little effort. Instead of copying functions down to an array of every instantiation, which given a high number of plugins can mean a significant cost in a hot code path, we can utilise JavaScript’s prototypes to only define them once.
class Thing {
  static addPlugins (plugins) {
    class ThingWithPlugins extends this {}
    for (const { name, fn } of plugins) {
      ThingWithPlugins[name] = fn
    }
    return ThingWithPlugins
  }
}
In special cases, we can use the eval function in JavaScript to take this pattern of code generation even further but that’s for another post as that opens a whole other dimension of pros and cons!
Personally I quite like this pattern, as it often leads to faster code whilst, in my opinion, not sacrificing readability.
For hapi, we suggested this pattern and implemented a prototype which landed in this commit. This patch made the cost of adding plugins basically zero instead of adding an overhead depending on how many plugins the user would use.
For some specific programs such as parsers, using code generation can speed up execution by many magnitudes, so this pattern is always a good idea to keep in mind if it can be applied to your own codebase.
Promises and garbage collection
After applying the above-mentioned fixes we measured a significant performance boost. On our next iteration, however, we stumbled into an interesting problem that turned out to be a bit of a head-scratcher. The main simple benchmark server for hapi looks like this:
server.route({
  ...,
  handler: async function (request, h) {
     return { hello: 'world' }
  }
})
When introducing a simple setTimeout to be above handler we saw significant performance degradations.
async function (request, h) {
  // wait 1ms before responding
  await new Promise(resolve => setTimeout(resolve, 1))
  return { hello: ‘world’ }
}
When running the above bench we’d expect the request per second performance to be more or less unchanged, and perhaps the average request latency to increase a tiny bit due to the 1ms delay on every request.
Instead of that, we saw a big drop in performance of around 50%!
Something was off.
We did a lot of profiling to try to detect why this would have such a big impact, and in the end, by enabling the --trace-gc flag we found a strong signal to what could be wrong. The garbage collection pauses were much longer on the version with the 1ms delay compared to unchanged one. Additionally using the Bubbleprof tool from Clinic.js we saw a lot of promises being in memory for each request.
To get a better understanding of what was happening we ran the benchmarks again with Node.js in debug mode and attached dev tools. If you haven’t done this before it’s actually quite easy and a super powerful way to debug your application. Just run node --inspect app.js and open Google Chrome’s dev tools. There you’ll now see the Node.js icon and by clicking on that you’ll have a dev tools session, but for your Node.js program. [caption id="attachment_300008510" align="alignnone" width="853"]

(Heap snapshot of the benchmark with no delay)[/caption]
Since we were debugging memory usage and garbage collection we decided to do a series of heap snapshots during the benchmark that we could then compare against. It showed a very clear result. In the version with 1ms delay, thousands of promises were clogging up the memory compared to the non-delayed one.
With this in mind, we dug through the source code again and noticed that for each request, in the hot path, many async functions were awaited. We know from our experience that although easy to use async functions can create a significant amount of memory pressure so when we see those in a hot path we consider that a strong signal.
[caption id="attachment_300008511" align="alignnone" width="1024"]

(Heap snapshot with 1ms response delay)[/caption]
Notice how there is a ton of Promises in the profile now
Luckily for us, in hapi most of them were only async in rare cases. For example, hapi supports user-defined encoders in addition to JSON etc. To support different use cases these functions were awaiting internally, although the vast majority of users only use synchronous encoding schemes.
async function onrequest () {
  …
  // This creates a series of promises, even for synchronous encoders.
  res.end(await customEncoder(result))
}
By carefully crafting synchronous fast paths in the request lifecycle whenever the async behaviour was optional like in the above use case we saw a significant performance increase in the delayed benchmark, making it comparable to the undelayed one by removing the GC pressure.
We can see the performance fixes reflected on the benchmarks as well. This autocannon profile is from before the async fixes:

- Req/Bytes counts sampled once per second.
- 105k requests in 10.08s, 17.2 MB read
And this one is after.

- Req/Bytes counts sampled once per second.
- 121k requests in 10.08s, 19.9 MB read
A decent ~20% increase.
Conclusion
All in all, we were able to squeeze out a 30% performance boost in hapi using relatively simple changes.
Try to look for the simple performance patterns first and ask yourself if you really need to make your code faster. It almost always comes at a readability cost. Give Clinic.js a try, it’s usually good for predicting what to look for. For more info on how others are using Clinic.js to improve performance check out our article Clinic.js rises to the top in diagnosing Node.js performance issues .
Although async functions are easy to sprinkle everywhere their performance cost can be significant for hot paths so try to limit them if you can. If your code is optionally async like the encoding use case above, perhaps make a fast path and slow path. On the plus side, since async functions are relatively new and implemented in JavaScript itself, the virtual machines will surely make this faster and less memory intensive in the future.
Insight, imagination and expertly engineered solutions to accelerate and sustain progress.
Contact