How to build a real-time Node.js Performance Monitoring System
Performance monitoring of a Node.js app: Step by step instructions
In this post, we are going to walk through how to build your own real-time performance monitoring of a NodeJS app and how this can be used to detect issues on live servers.
We will be using technologies like Elasticsearch, Kibana, Docker Compose, and several NodeJS modules developed here at NearForm.
We show how you can use Docker Compose to run locally or on AWS and we have also created a Vagrantfile that will spin up all the necessary resources if you wish to run it locally on a hypervisor like VirtualBox.
Quick Setup
Like our other posts that cover several repos, we have created a quick and easy setup for the resources needed to walk through this tutorial locally.
We have defined the services needed in a Dockerfile. Follow the steps below to spin up resources needed:
If you have Docker Compose installed locally or a cloud provider like AWS then use docker-compose:
git clone https://github.com/nearform/slow-rest-api.git
  cd slow-rest-api
  git checkout stats-demo
  cd stats-demo
  docker-compose up
Verify
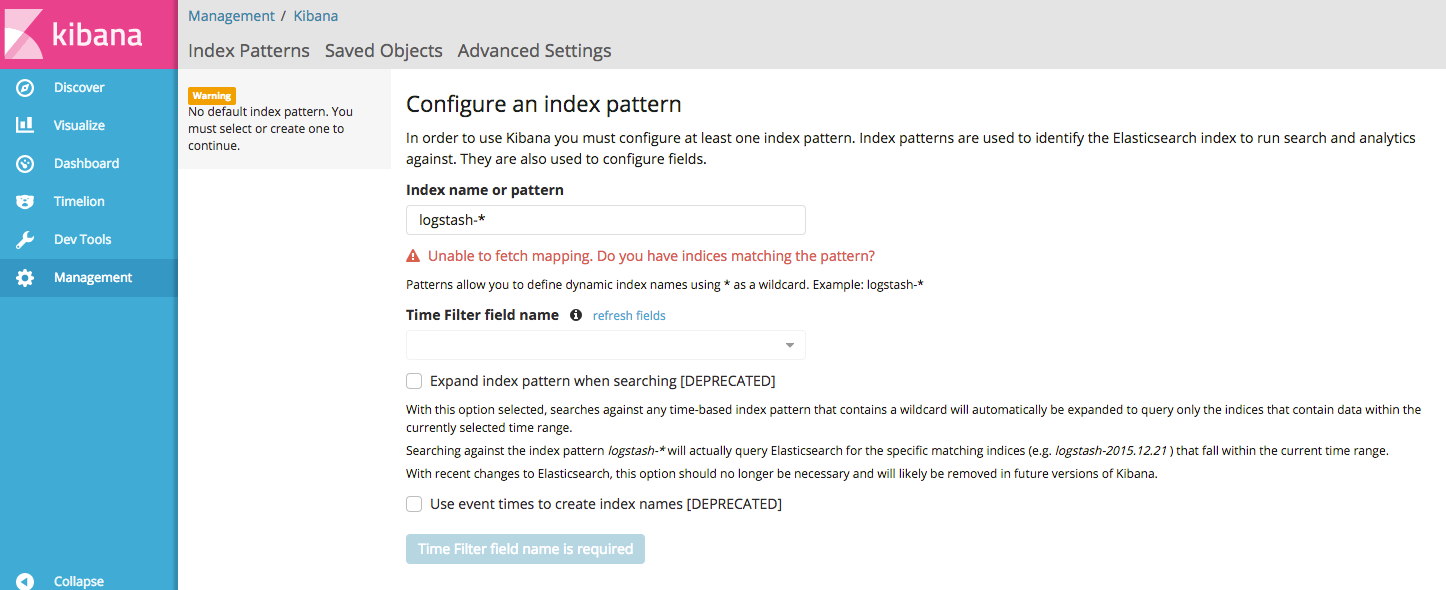
Installation will take about 5 minutes to finish but once done you should be able to bring up Kibana in your browser at https://localhost:5601/
What it looks like after successful installation.
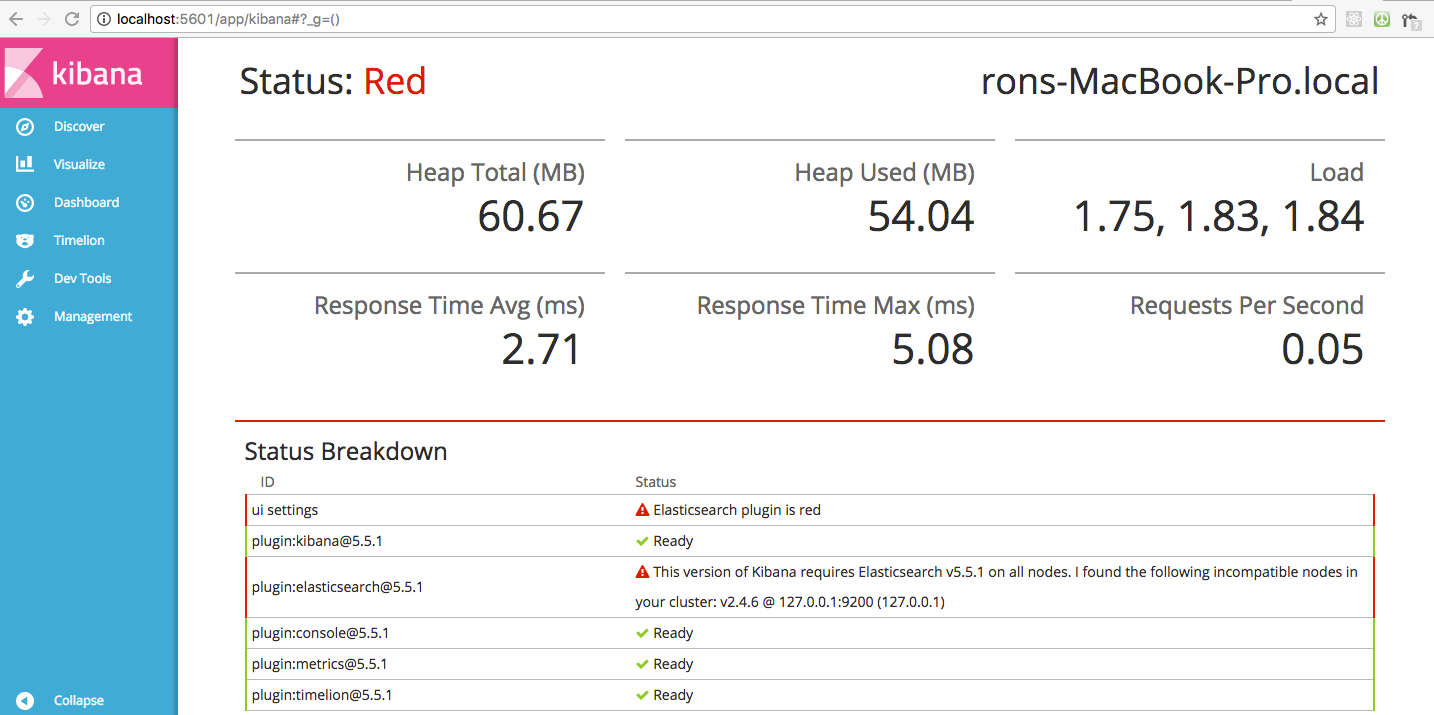
Note: Running Kibana and Elasticsearch on a different major version is not supported .
If you have a mismatched version, you will see an error like below:
Node Modules Needed:
We open sourced a few modules for the real time dashboard, and Ill go over each one.
A link to all resources is at the end of this post.
Stats:
We needed a tool to generate statistics about our running processes, so to do this, we developed the Stats module.
This simple module is used to create a simple event emitter object that emits an event called stats. It contains useful information about the current host machine, the node.js process itself, Garbage Collection within the process and information about how long it is taking your event loop to empty itself and move onto its next iteration.
You can also configure this to add tags to your stats, and it generates a unique id per emitter so you can track down stats for a particular emitter.
Click here to learn more: https://github.com/nearform/stats
STATS-TO-ELASTICSEARCH:
The next module, Stats-to-elasticsearch, makes it very easy for you to send your stats from in process to your elasticsearch server. T
his module instantiates the stats event emitter for you, so you simply use this module, and you're ready to go.
You can even preload your node.js process with this module, requiring no changes to your codebase.
Click here to learn more: https://github.com/nearform/stats-to-elasticsearch
CREATE-STATS-DASHBOARD:
Now that you have your stats sent to your elasticsearch server you can install the dashboard for Kibana to visualize it.
To do this, we created the module create-stats-dashboard that makes it very easy to install the dashboard. When you have this module installed through npm, you can run the command create-stats-dashboard to create the dashboard.
It has support configuration env variables to hook it up to any elasticsearch server for creating your dashboard.
Click here to learn more: https://github.com/nearform/create-stats-dashboard
Slow API Troubleshooting
Next, we want to show you how you can use these tools to identify performance issues on a running server.
Run docker ps command to see elasticsearch, Kibana, and two slow-rest-api containers on port 3000 and 3001.
Docker ps will show you the 4 processes running:

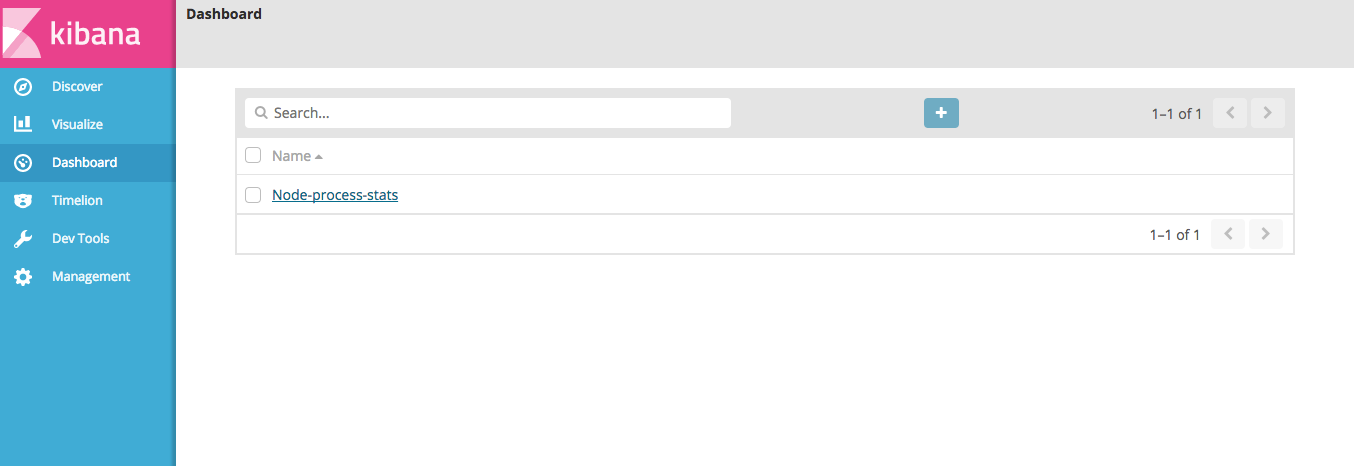
Now open Kibana in your browser and click dashboard. You will see that it needs a dashboard created.
Install dashboard
We have created a model for generating the dashboard in Kibana.
Just use npm install and then run create-stats-dashboard.
npm i -g @nearform/create-stats-dashboard

Create-stats-dashboard
Now go to Kibana localhost/5601 and click dashboard, you should see the dashboard like below:
Then click Node-process stats and:
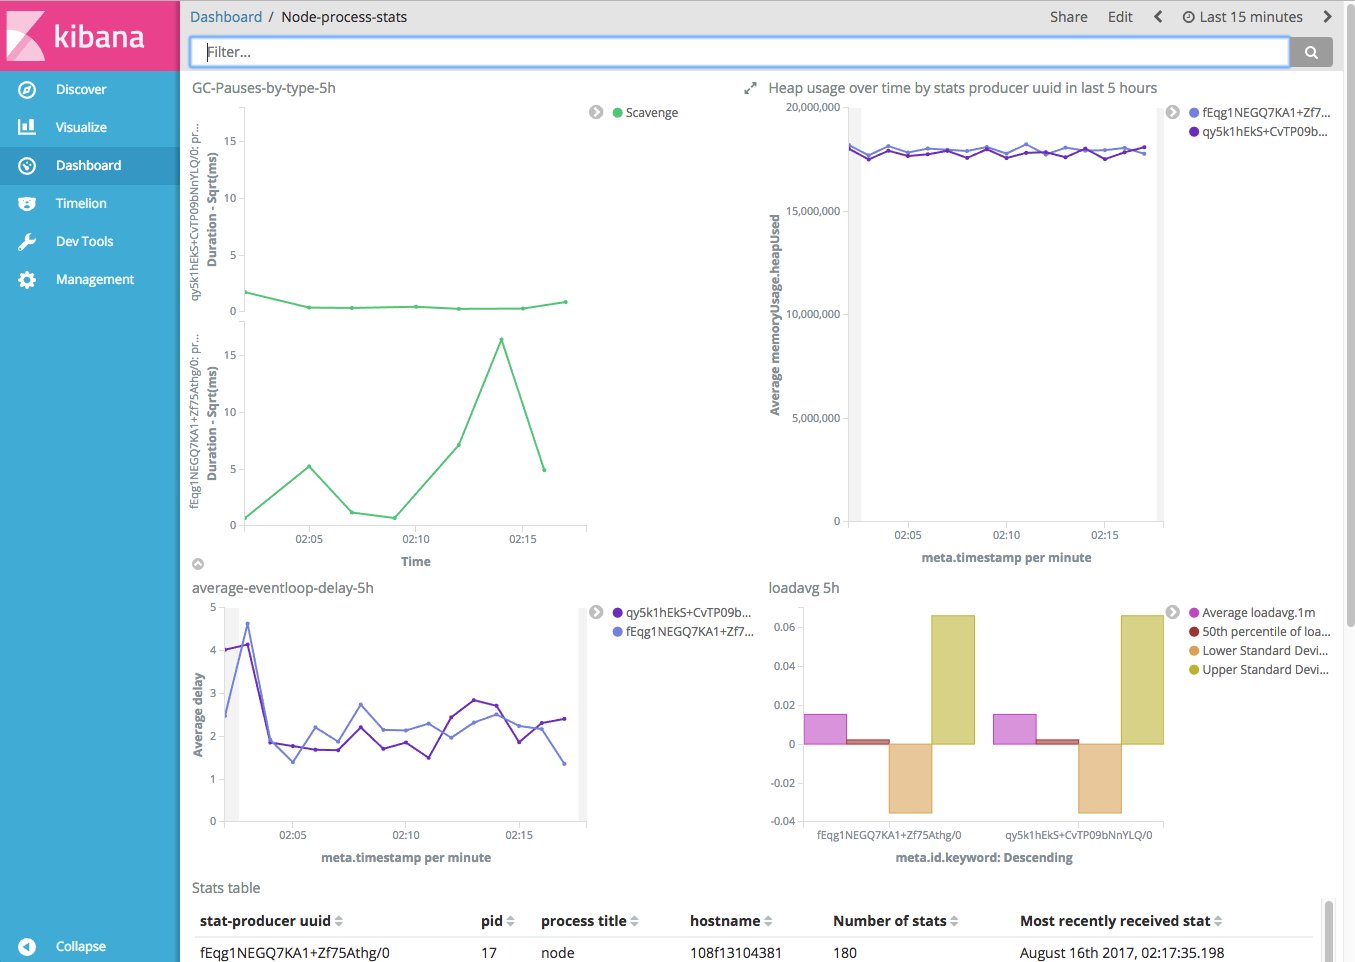
Your dashboard now can show real time what is happening with your app. However, since there is no load, it's not going to show you much.
Lets add load using Autocannon.
npm i -g autocannon

npm i -g concurrently

concurrently "autocannon -f -c 50 localhost:3000/a" "autocannon -f -c 50 localhost:3000/b" "autocannon -f -c 50 localhost:3000/c"
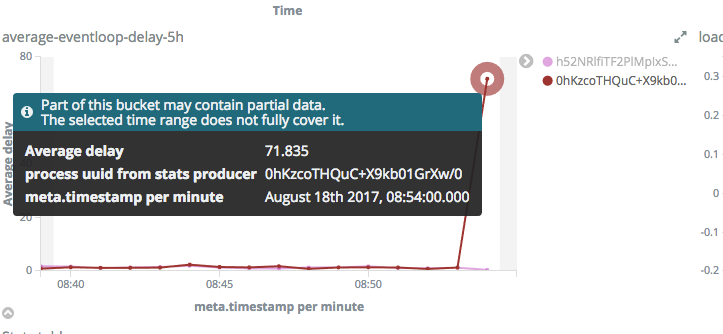
In Kibana, you should start to see the average event loop delay is increasing caused by the slow rest api.
You can also drill into the slow process and dig into the logs to investigate a specific process.
And look closer at the event-loop delay:
Conclusion
Thanks for going through the real-time monitoring demo.
There are more details in the readme of each of the modules we covered.
We hope you found this helpful.
NearForm Open Source Repos:
Vagrant real-time stats monitor install: https://github.com/nearform/realtime-stats-monitor Docker: https://docs.docker.com/compose/install/ Elasticsearch install: https://www.elastic.co/guide/en/elasticsearch/reference/2.4/_installation.html Kibana install: https://www.elastic.co/downloads/kibana
Additional resources on Node.js performance
Clinic.js rises to the top in diagnosing Node.js performance issues 5 benefits of Node.js for Digital Enterprise The Cost of Logging & Node.js Performance: Tech Talk Video Tuning Node.js app performance with Autocannon and 0x Sematext Guest Post: PINO – The Fastest Node.js Logger for Production Hapi: A Performance deep-dive Speeding up React SSR: Announcing ESX
Insight, imagination and expertly engineered solutions to accelerate and sustain progress.
Contact